SeqMonk 1.48.0 – Visualisation and Analysis of Mapped Sequence Data

SeqMonk 1.48.0

:: DESCRIPTION

SeqMonk is a program to enable the visualisation and analysis of mapped sequence data. It was written for use with mapped next generation sequence data but can in theory be used for any dataset which can be expressed as a series of genomic positions.

:: DEVELOPER

Babraham Bioinformatics

:: SCREENSHOTS

:: REQUIREMENTS

  • Linux / Mac OsX/Windows
  • Java 

:: DOWNLOAD

 SeqMonk

:: MORE INFORMATION

Cytoscape.js 3.18.2 – Graph Theory Library for Visualisation and Analysis

Cytoscape.js 3.18.2

:: DESCRIPTION

Cytoscape.js is an open-source JavaScript-based graph library. Its most common use case is as a visualization software component, so it can be used to render interactive graphs in a web browser.

::DEVELOPER

the Donnelly Centre at the University of Toronto.

:: SCREENSHOTS

N/A

:: REQUIREMENTS

  • Weindows/Linux/MacOsX
  • JavaScript

:: DOWNLOAD

 Cytoscape.js

:: MORE INFORMATION

Citation

Cytoscape.js: a graph theory library for visualisation and analysis.
Franz M, Lopes CT, Huck G, Dong Y, Sumer O, Bader GD.
Bioinformatics. 2015 Sep 28. pii: btv557.

MIDAS 1.0 – Analysis and Visualisation of Interallelic Disequilibrium between Multiallelic Markers

MIDAS 1.0

:: DESCRIPTION

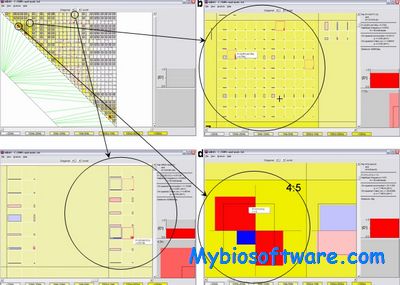
MIDAS (Multiallelic Interallelic Disequilibrium Analysis Software) is a linkage disequilibrium analysis program with a comprehensive graphical user interface providing novel views of patterns of linkage disequilibrium between all types of multiallelic and biallelic markers.

::DEVELOPER

Tom Gaunt’s group in the MRC IEU

:: SCREENSHOTS

:: REQUIREMENTS

  • Linux /Mac OsX / Windows
  • Python

:: DOWNLOAD

 MIDAS

:: MORE INFORMATION

Citation:

Tom R Gaunt, Santiago Rodriguez, Carlos Zapata, Ian NM Day
MIDAS: software for analysis and visualisation of interallelic disequilibrium between multiallelic markers.
BMC Bioinformatics 2006, 7:227 (27 April 2006)

DisVis 2.0 – Visualisation of Conformational Space Restriction by Distance Restraints

DisVis 2.0

:: DESCRIPTION

DisVis is a Python package and command line tool to visualize and quantify the accessible interaction space of distance restrained binary biomolecular complexes.

:DEVELOPER

BONVIN LAB

:: SCREENSHOTS

N/A

:: REQUIREMENTS

  • Windows/ Linux / MacOsX
  • Python

:: DOWNLOAD

 DisVis

:: MORE INFORMATION

Citation

DisVis: Quantifying and visualizing accessible interaction space of distance-restrained biomolecular complexes.
van Zundert GC, Bonvin AM.
Bioinformatics. 2015 May 29. pii: btv333.

MAVisto 2.7.0 – Motif Analysis and VISualisation TOolkit

MAVisto 2.7.0

:: DESCRIPTION

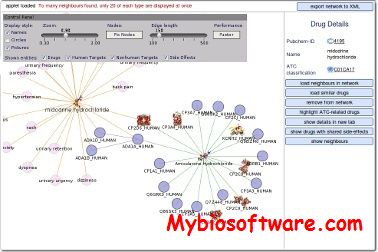
MAVisto (Motif Analysis and VISualisation TOolkit)is a tool for the exploration of motifs in network. It provides a flexible motif search algorithm and different views for the analysis and visualisation of network motifs.

::DEVELOPER

Life Science Informatics – Prof. Dr. Falk Schreiber

:: SCREENSHOTS

:: REQUIREMENTS

  • Windows / Linux/  MacOSX
  • Java

:: DOWNLOAD

 MAVisto

:: MORE INFORMATION

Citation

Schreiber, F. and Schwöbbermeyer H.
MAVisto: a tool for the exploration of network motifs.
Bioinformatics, 21, 3572-3574, 2005.

Cobweb 1.1.1 – Network Exploration and Visualisation

Cobweb 1.1.1

:: DESCRIPTION

Cobweb is a Java applet for real-time network visualization; its strength lies in enabling the interactive exploration of networks.

::DEVELOPER

Structural Bioinformatics Group

:: SCREENSHOTS

:: REQUIREMENTS

  • Windows/Linux/MacOsX
  • Java

:: DOWNLOAD

 Cobweb

:: MORE INFORMATION

Citation

Bioinformatics. 2011 Jun 15;27(12):1725-6. doi: 10.1093/bioinformatics/btr195. Epub 2011 Apr 12.
Cobweb: a Java applet for network exploration and visualisation.
von Eichborn J1, Bourne PE, Preissner R.

ALVIS 0.1 – Explorative Analysis and Visualisation of Multiple Sequence Alignments

ALVIS 0.1

:: DESCRIPTION

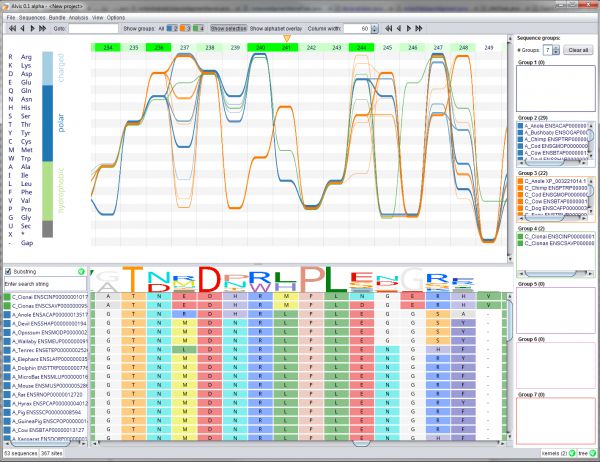
Alvis (Interactive non-aggregative multiple sequence ALignment VISualisation) is an open-source platform for the joint explorative analysis of MSAs and phylogenetic trees, employing Sequence Bundles as its main visualisation method.

::DEVELOPER

Goldman Group

:: SCREENSHOTS

:: REQUIREMENTS

  • Linux / Windows /MacOsX
  • Java

:: DOWNLOAD

ALVIS

:: MORE INFORMATION

Citation

Nucleic Acids Res. 2016 May 5;44(8):e77. doi: 10.1093/nar/gkw022.
ALVIS: interactive non-aggregative visualization and explorative analysis of multiple sequence alignments.
Schwarz RF, Tamuri AU, Kultys M, King J, Godwin J, Florescu AM, Schultz J, Goldman N.

DNAscan 0.1 – Personal Computer compatible NGS Analysis, Annotation and Visualisation

DNAscan 0.1

:: DESCRIPTION

DNAscan is a fast and efficient bioinformatics pipeline that allows for the analysis of DNA Next Generation sequencing data, requiring very little computational effort and memory usage.

::DEVELOPER

DNAscan team

:: SCREENSHOTS

N/A

:: REQUIREMENTS

  • Linux
  • Python

:: DOWNLOAD

DNAscan

:: MORE INFORMATION

Citation:

BMC Bioinformatics. 2019 Apr 27;20(1):213. doi: 10.1186/s12859-019-2791-8.
DNAscan: personal computer compatible NGS analysis, annotation and visualisation.
Iacoangeli A et al.

RnamlView 1.0 – Manipulation, Storage & Visualisation of RNA Data

RnamlView 1.0

:: DESCRIPTION

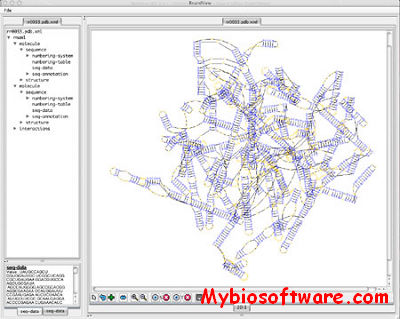
RnamlView is a visualization tool that displays/edits 2-dimensional diagrams of RNA/DNA secondary structures with tertiary interactions created by RNAView (above). The application generates standard molecular representations (e.g. tRNA cloverleaf structures) or any structural representation desired by the user by rearranging various parts (e.g helices and single strands) of the RNAView 2D diagrams. RNA motifs are rapidly identified and classified with the base pair annotation and the 2D graphic display.

::DEVELOPER

Fabrice Jossinet, & Eric Westhof, Institut de biologie moleculaire et cellulaire du CNRS

:: SCREENSHOTS

:: REQUIREMENTS

:: DOWNLOAD

RnamlView

:: MORE INFORMATION

Citation

Yang, H., Jossinet, F., Leontis, N., Chen, L., Westbrook, J., Berman, H.M., Westhof, E. (2003).
Tools for the automatic identification and classification of RNA base pairs.
Nucleic Acids Research 31.13: 3450-3460.

ClusterViz 0.2 – Cluster Visualisation

ClusterViz 0.2

:: DESCRIPTION

ClusterViz is a software to visualize the clustering process using the family of k-means algorithms. ClusterViz allows to cluster data while visualizing an up to three dimensional projection. The clustering process is visualized using OpenGL. As clustering algorithms the family of k-means algorithms is implemented, including mixture models.

::DEVELOPER

Alexander Schliep’s group for bioinformatics

:: SCREENSHOTS

N/A

:: REQUIREMENTS

:: DOWNLOAD

 ClusterViz

:: MORE INFORMATION

Exit mobile version