clusterProfiler 3.14.0 – Statistical Analysis and Visulization of Functional Profiles for Genes and Gene Clusters

clusterProfiler 3.14.0

:: DESCRIPTION

clusterProfiler implements methods to analyze and visualize functional profiles (GO and KEGG) of gene and gene clusters.

::DEVELOPER

Guangchuang YU,, Li-Gen Wang

:: SCREENSHOTS

N/A

:: REQUIREMENTS

  • Linux/ Windows/MacOsX
  • R package
  • BioConductor

:: DOWNLOAD

  clusterProfiler

:: MORE INFORMATION

Citation

OMICS. 2012 May;16(5):284-7. doi: 10.1089/omi.2011.0118. Epub 2012 Mar 28.
clusterProfiler: an R package for comparing biological themes among gene clusters.
Yu G1, Wang LG, Han Y, He QY.
COLOMBO 4.0 / SIGI-HMM – Statistical Analysis of Sequences of a Genome /Prediction of Genomic Islands in Prokaryotic Genomes

COLOMBO 4.0

:: DESCRIPTION

COLOMBO is a software framework equipped with a GUI for the statistical analysis of sequences of a genome. It can be equipped with different plugins that actually perform the analysis. The current version of COLOMBO is supplied with SIGI-HMM, a tool for the prediction of Genomic Islands.

::DEVELOPER

Theoretical Computer Science and Algorithmic Methods , at the University of Göttingen.

:: SCREENSHOTS

N/A

:: REQUIREMENTS

  • Windows / Linux / MacOsX
  • Java
  • Perl

:: DOWNLOAD

COLOMBO

:: MORE INFORMATION

Citation

Score-based prediction of genomic islands in prokaryotic genomes using hidden Markov models.
Waack S, Keller O, Asper R, Brodag T, Damm C, Fricke WF, Surovcik K, Meinicke P, Merkl R.
BMC Bioinformatics. 2006 Mar 16;7:142.

RNApasta 1.6 – RNA Structural Alignment & Statistical Analysis

RNApasta 1.6

:: DESCRIPTION

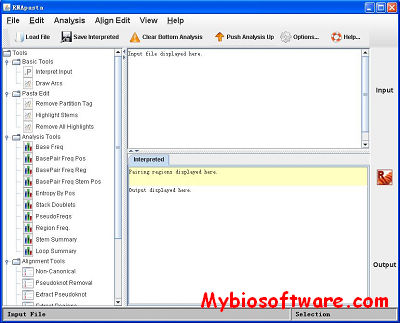
RNApasta is a utility for collecting statistics from aligned and structurally annotated RNA sequences.RNApasta is a java utility intended to work with RNA structural alignments, including the motifs of stem-loops and pseudoknots.  RNApasta can perform a variety of statistical analyses, and has editing capabilities intended to be useful with alignments that contain variable data such as the presence or absence of stem-loops or pseudoknots across sequences.  RNApasta can read Rfam-stockholm formatted files or pasta formatted files.

::DEVELOPER

The RNA-Informatics Research Lab

:: SCREENSHOTS

:: REQUIREMENTS

  • Windows / MacOsX / Linux
  • Java

:: DOWNLOAD

RNApasta

:: MORE INFORMATION

Citation

Malmberg, R., Shaw, T., and Cai, L. (2010)
RNApasta: a tool for analysis of RNA structural alignments,
Int J Bioinform Res Appl. 2010;6(6):571-83.

PLABSTAT 20110711 – Statistical Analysis of Plant Breeding Experiments

PLABSTAT 20110711

:: DESCRIPTION

PLABSTAT (PLAnt Breeding STATistical program) is a concise package to analyse plant breeding experiments (lattices, unreplicated and multi-factor experiments)..PLABSTAT estimates basic statistics, e.g. variance, skewness, curtosis, and coefficients of correlation. Simple or multiple linear regression including path coefficients are also calculated.

::DEVELOPER

H. Friedrich Utz

:: SCREENSHOTS

N/A

:: REQUIREMENTS

  • windows

:: DOWNLOAD

 PLABSTAT

:: MORE INFORMATION

SARS – Statistical Analysis of Real-time PCR Software

SARS

:: DESCRIPTION

SARS is a software package for statistical analysis of Real-time PCR data.

::DEVELOPER

Joshua Yuan lab

:: SCREENSHOTS

N/A

:: REQUIREMENTS

  • Linux/ Windows/ MacOsX
  • Python
  • R package

:: DOWNLOAD

 SARS

:: MORE INFORMATION

Citation

Statistical analysis of real-time PCR data.
Yuan JS, Reed A, Chen F, Stewart CN Jr.
BMC Bioinformatics. 2006 Feb 22;7:85.

HDXanalyzer 1.0 – Statistical Analysis of Protein Structure Dynamics

HDXanalyzer 1.0

:: DESCRIPTION

HDXanalyzer is software package to enable the statistical analysis of HDX mass spectrometry data. The software will help the protein structure dynamics study tremendously.

::DEVELOPER

Joshua Yuan lab

:: SCREENSHOTS

:: REQUIREMENTS

  • Linux/ Windows/ MacOsX
  • Python

:: DOWNLOAD

 HDXanalyzer

:: MORE INFORMATION

Citation

BMC Bioinformatics. 2011 Feb 15;12 Suppl 1:S43. doi: 10.1186/1471-2105-12-S1-S43.
HDX-analyzer: a novel package for statistical analysis of protein structure dynamics.
Liu S, Liu L, Uzuner U, Zhou X, Gu M, Shi W, Zhang Y, Dai SY, Yuan JS.

StAR – Statistical Analysis of Receiver Operating Characteristic (ROC) Curves

StAR

:: DESCRIPTION

StAR is a web server and standalone program for the statistical comparison of several binary classifiers. This server assesses the statistical significance of the observed differences between two or more classifiers by means of their ROC (Receiver Operating Characteristic) curves. The statistical comparison relies on a non-parametric test and the area under the ROC curves (AUCs). The server is able to perform the simultaneous pairwise comparison of many binary classifiers.

::DEVELOPER

Francisco Melo Ledermann

:: SCREENSHOTS

N/A

:: REQUIREMENTS

  • Linux

:: DOWNLOAD

 StAR

:: MORE INFORMATION

Citation

Vergara, I.A., Norambuena, T., Ferrada, E., Slater, A.W. and Melo, F. (2008)
StAR: a simple tool for the statistical comparison of ROC curves.
BMC B ioinformatics 9, 265.

EpiGRAPH 1.0 – Statistical Analysis and Prediction of Epigenomic data

EpiGRAPH 1.0

:: DESCRIPTION

EpiGRAPH enables biologists to analyze genome and epigenome datasets with powerful statistical and machine learning methods. In a typical workflow, the user uploads a set of genomic regions of interest (e.g. experimentally mapped enhancers, hotspots of epigenetic regulation or sites exhibiting disease-specific alterations), and EpiGRAPH searches a large database of (epi-) genomic attributes for significant overlap and correlation with the regions in the input dataset. Furthermore, EpiGRAPH can predict the status of genomic regions that were not included in the input dataset.

::DEVELOPER

Max-Planck-Institut Informatik

:: SCREENSHOTS

N/A

:: REQUIREMENTS

  • Web Browser

:: DOWNLOAD

 No

:: MORE INFORMATION

Citation

EpiGRAPH: user-friendly software for statistical analysis and prediction of (epi)genomic data.
Bock C, Halachev K, Büch J, Lengauer T.
Genome Biol. 2009 Feb 10;10(2):R14.

TileShuffle 0.2.0 – Statistical Analysis of Tiling Array Expression Data

TileShuffle 0.2.0

:: DESCRIPTION

TileShuffle is a software of detection of transcribed or differentially expressed segments in tiling array data by permutation testing.This package contains functions for the analysis of tiling array data. It implements a statistical approach to detect expression or differential expression in terms of differences from the background distribution that avoids any intensity-related parameters. Moreover, it reduces the most dominant tiling array biases using an affinity-dependent permutation in conjunction with a windowing approach.

::DEVELOPER

Kristin Reiche

:: SCREENSHOTS

N/A

:: REQUIREMENTS

:: DOWNLOAD

 TileShuffle

:: MORE INFORMATION

SAGE 6.3 – Statistical Analysis for Genetic Epidemiology

SAGE 6.3

:: DESCRIPTION

SAGE (Statistical Analysis for Genetic Epidemiology) is free but licensed software package containing programs for use in the genetic analysis of family, pedigree and individual data.

::DEVELOPER

Department of Epidemiology and Biostatistics, Case Western Reserve University

:: SCREENSHOTS

:: REQUIREMENTS

  • Windows / Linux

:: DOWNLOAD

 SAGE

:: MORE INFORMATION

Exit mobile version