DWD – Perform Systematic Bias Adjustment in microarray data.

DWD

:: DESCRIPTION

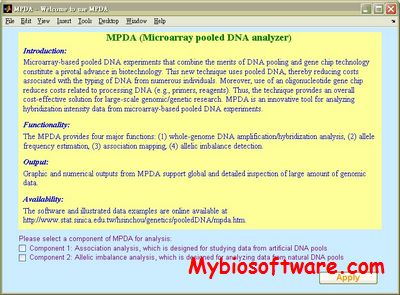
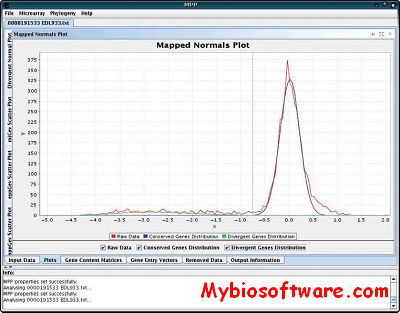
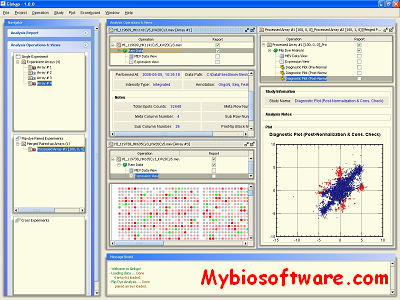
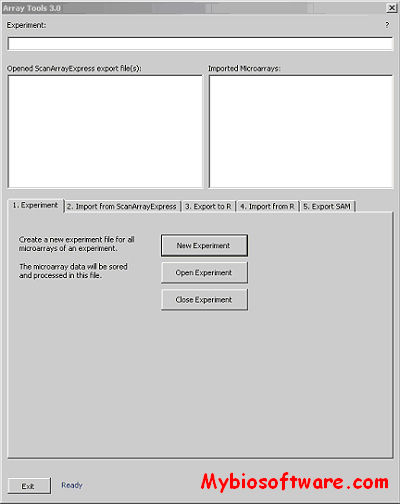
DWD (Distance Weighted Discrimination) can perform systematic bias adjustment in microarray data.

::DEVELOPER

Dr. J. S. Marron in the Department of Statistics at University of North Carolina at Chapel Hill.
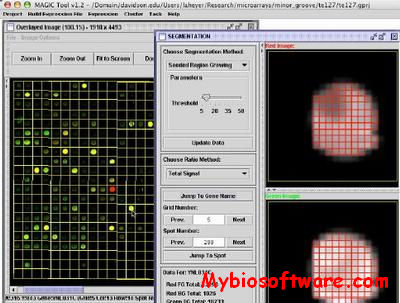
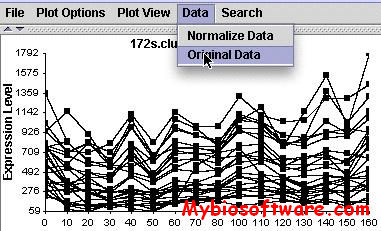
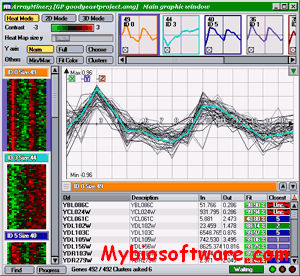
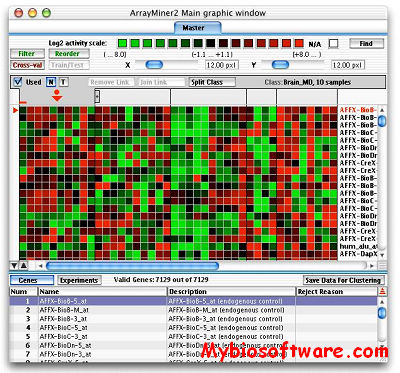
:: SCREENSHOTS

::REQUIREMENTS

:: DOWNLOAD

 DWD

:: MORE INFORMATION

Citation

Adjustment of Systematic Microarray Data Biases.
M. Benito, J. Parker, Q. Du, J. Wu, D. Xiang, C. Perou, J. Marron
Bioinformatics 20:105-144, 2004

MPDA 20081110 – Microarray Pooled DNA Analyzer

MPDA 20081110

:: DESCRIPTION

MPDA (Microarray Pooled DNA Analyzer) is an innovative tool for analyzing hybridization intensity data from microarray-based pooled DNA experiments. Graphic and numerical outputs from MPDA support global and detailed inspection for bulk of genomic data.

::DEVELOPER

Hsin-Chou Yang and Cathy SJ Fann(Institute of Biomedical Sciences, Academia Sinica, Taiwan)

:: SCREENSHOTS

::REQUIREMENTS

:: DOWNLOAD

 MPDA

:: MORE INFORMATION

Citation

Hsin-Chou Yang, Mei-Chu Huang, Ling-Hui Li, Chien-Hsing Lin, Alice L. T. Yu, Mitchell B. Diccianni, Jer-Yuan Wu, Yuarn-Tsong Chen, Cathy S. J. Fann (2008).
MPDA: Microarray Pooled DNA Analyzer.
BMC Bioinformatics. 9:196.

M-BISON 1.0 – Microarray-Based Integration of data SOurces using Networks

M-BISON 1.0

:: DESCRIPTION

M-BISON is a software to implement an efficient method for the integration of biological knowledge with microarray gene expression data to enhance identification of differentially expressed genes

::DEVELOPER

M-BISON Team

:: SCREENSHOTS

N/A

:: REQUIREMENTS

:: DOWNLOAD

 M-BISON

:: MORE INFORMATION

Citation

Bernie J Daigle Jr and Russ B Altman
M-BISON: Microarray-based integration of data sources using networks
BMC Bioinformatics 2008, 9:214

MPP 2.0 – Microarray-to-Phylogeny Pipeline

MPP 2.0

:: DESCRIPTION

MPP (Microarray-to-Phylogeny-Pipeline) is a Java application, encompassing both new and established algorithms, for the analysis of gene and marker content datasets arising from high-throughput microarray techniques. MPP analyses flat file output from microarray experiments to determine the probability of the presence or absence of genes or markers within a genome. MPP can construct gene or marker content datasets for a number of genomes and can use the data to estimate an evolutionary tree or network. Results from gene content analyses may be validated by comparing them to known gene contents. MPP was initially developed to analyse data derived from comparative genome hybridization (CGH) microarray experiments in fungi and bacteria. It has recently been adapted to analyse retrotransposonbased insertion polymorphism (RBIP) marker scores derived from tagged microarray marker (TAM) experiments in pea. New analytical procedures may be added easily to MPP as plugins in order to increase the scope of the software.

::DEVELOPER

 DICKS COMPUTATIONAL BIOLOGY GROUP

:: SCREENSHOTS

:: REQUIREMENTS

:: DOWNLOAD

 MPP

:: MORE INFORMATION

Citation:

Davey RP, Savva G, Dicks J and Roberts IN (2007)
MPP: A Microarray-To-Phylogeny Pipeline for Analysis of Gene and Marker Content Datasets.
Bioinformatics 23 (8): 1023-1025

MAmodel 20060511 – Microarray Simulator

MAmodel 20060511

:: DESCRIPTION

MAmodel is a microarray simulation model which can be used to validate different kinds of data analysis algorithms. The proposed model is unique in the sense that it includes all the steps that affect the quality of real microarray data. These steps include the simulation of biological ground truth data, applying biological and measurement technology specific error models, and finally simulating the microarray slide manufacturing and hybridization. After all these steps are taken into account, the simulated data has realistic biological and statistical characteristics.

::DEVELOPER

Computational Systems Biology Research group

:: SCREENSHOTS

N/A

:: REQUIREMENTS

  • Windows / Linux / MacOsX
  • MATLAB

:: DOWNLOAD

MAmodel

:: MORE INFORMATION

Citation:

M. Nykter, T. Aho, M. Ahdesmäki, P. Ruusuvuori, A. Lehmussola, and O. Yli-Harja.
Simulation of microarray data with realistic characteristics.
BMC Bioinformatics, 7(349), 2006.

Ginkgo 1.01 – CGH & Expression Microarray Data Analysis & Normalization

Ginkgo 1.01

:: DESCRIPTION

Ginkgo is a spotted microarray data pre-processing platform featuring analysis functionalities for CGH (Comparative Genomic Hybridization) and expression data. This application provides a user-friendly graphical interface that allows viewing, analyzing, generating and reporting microarray data, easily and intuitively. Within the software there are a number of algorithms to address microarray data analysis needs, including normalization, filtering, data imputation, replicates merge, and expression statistical distribution tests.

::DEVELOPER

J. Craig Venter Institute

:: SCREENSHOTS

:: REQUIREMENTS

  • Linux / Windows
  • JAVA

:: DOWNLOAD

Ginkgo

:: MORE INFORMATION

This application is released under the GPL v3 License: View License

Citation:

Quackenbush, J. Microarray data normalization and transformation. Nature Genetics. Vol.32 supplement pp496-501 (2002).

Array Tools 3.3 – Dictyostelium Discoideum Microarray Data Analysis

Array Tools 3.3

:: DESCRIPTION

Array Tools is a Microsoft Excel Add-In, which is designed to handle the import and export of Dictyostelium discoideum microarray data. It can be used to:

  • Import ScanArray Express CSV to Excel.
  • Export the data to R by creating Data.spot, R Commands. R and Arrays.txt files.
  • Re-importing data from R to Excel.
  • Exporting data to SAM

::DEVELOPER

Ludwig Eichinger

:: SCREENSHOTS

:: REQUIREMENTS

:: DOWNLOAD

Array Tools

:: MORE INFORMATION

Contact:
Ludwig Eichinger
Institut für Biochemie Köln, Zentrum Biochemie
University of Cologne
http://www.uni-koeln.de/med-fak/biochemie/transcriptomics/

MAGIC Tool 2.1 – MicroArray Genome Imaging & Clustering Tool

MAGIC Tool 2.1

:: DESCRIPTION

MAGIC Tool is an integrated microarray data analysis software.

The purpose of MAGIC Tool is to allow the user to begin with DNA microarray tiff files and end with biologically meaningful information. Comparative hybridization data (glass chips) and Affymetrix data are compatible with MAGIC Tool. You can start with tiff files or expression files.

MAGIC Tool allows the user to change parameters for clustering, data quantification etc.

::DEVELOPER

Laurie Heyer

:: SCREENSHOTS

:: REQUIREMENTS

  • Windows/Mac/ Linux/ UNIX
  • Java

:: DOWNLOAD

MAGIC Tool ;  User’s Guide

:: MORE INFORMATION

Free software with open source.

Paper: MAGIC Tool: Integrated microarray data analysis (Bioinformatics, 2005)

Venn Mapper 1.01 – Compare Heterologous Microarray Data Sets

Venn Mapper 1.01

:: DESCRIPTION

Venn Mapper is a program that cluster heterologous microarray data based on the number of co-occurring differentially expressed genes. The application loads microarray data (gene expression ratios) and determines which genes are up- or down-regulated by a user-defined ratio cut-off level. For each experiment, lists of differentially expressed genes are computed. Every list will be compared to every other list, and the number of co-occurring genes will be calculated. With the use of the binomial distribution, so called z-values can be assigned to the overlap found between two lists. The z-values can be directly imported into the Cluster and/or TreeView software.

::DEVELOPER

Marcel Smid

:: SCREENSHOTS

:: REQUIREMENTS

  • Windows/ Other OS with Perl

:: DOWNLOAD

Venn Mapper for Win ; Perl Resource Code

:: MORE INFORMATION

Citation:

M. Smid ,L.C.J. Dorssers, G. Jenster, Venn Mapping: clustering of heterologous microarray data based on the number of co-occurring differentially expressed genes, Bioinformatics (2003) 19 (16): 2065-2071.

ArrayMiner 5.3 – Microarray Gene Expression Data Analysis

ArrayMiner 5.3

:: DESCRIPTION

ArrayMiner® is a set of analysis tools using advanced algorithms to reveal the true structure of your gene expression data. Its unique graphical interface gives you an intimate understanding of the analysis and an easy publishing of its results.

ArrayMiner include clustering module & classmarking module.

::DEVELOPER

Optimal Design

:: SCREENSHOTS

:: REQUIREMENTS

  • Windows / Mac OsX

:: DOWNLOAD

ArrayMiner Demo / Free Lite

:: MORE INFORMATION

In order to be eligible for the free light version, your institution must be academic. The light version is limited to 500 genes and 10 experiments for the clustering module and 500 genes for the ClassMarker tool. The light licence’s validity is 1 year.

Price List.

Exit mobile version