VarMixt 0.2-4 – Differential Analysis of Microarray data whose Variances are Modelled by a Mixture model

VarMixt 0.2-4

:: DESCRIPTION

VarMixt is an efficient variance modelling for the differential analysis of replicated gene expression data.

::DEVELOPER

SSB group.

:: SCREENSHOTS

N/A

:: REQUIREMENTS

  • Linux / Windows/ MacOsX
  • R pacakge

:: DOWNLOAD

 VarMixt

:: MORE INFORMATION

Citation

Bioinformatics. 2005 Feb 15;21(4):502-8.
VarMixt: efficient variance modelling for the differential analysis of replicated gene expression data.
Delmar P, Robin S, Daudin JJ.

OsCAS – Annotation platform for Rice Microarray data

OsCAS

:: DESCRIPTION

OsCAS (Oryza sativa Chips Annotation System) is a comprehensive system designed to annotate the results of rice microarray experiments and analysis relationships between genes based on their expression. The aim of the platform is to facilitate the study of differently expressed genes in the microarray experiments within the framework of systems biological research.

::DEVELOPER

Ming Chen’s Bioinformatics Group, Zhejiang University.

:: SCREENSHOTS

N/A

:: REQUIREMENTS

  • Web Browser

:: DOWNLOAD

 NO

:: MORE INFORMATION

Citation

Qingyun Shi, Yijun Meng, Dijun Chen, Fei He, Haibin Gu, Ping Wu, Ming Chen(2010)
OsCAS: a comprehensive web-based annotation platform for rice microarray data.
BioChip Journal, 4(1): 9-15.

PageMan 0.12 – Annotates, Investigates, and Condenses Microarray data in the Context of Functional Ontologies

PageMan 0.12

:: DESCRIPTION

PageMan is a tool to get a quick overview of multiparallel experiments. PageMan also helps comparing experiments from different organisms.

::DEVELOPER

Max Planck Institute for Molecular Plant Physiology

:: SCREENSHOTS

:: REQUIREMENTS

  • Windows/Linux/MacOsX
  • Java

:: DOWNLOAD

 PageMan

:: MORE INFORMATION

Citation

Usadel B, Nagel A, Steinhauser D, Gibon Y, Blaesing OE, Redestig H, Sreenivasulu N, Krall L, Hannah MA, Poree F, Fernie AR, Stitt M (2006)
PageMan an interactive ontology tool to generate, display, and annotate overview graphs for profiling experiments,
BMC Bioinformatics 18:7:535

ArrayMining – Online Microarray Data Mining

ArrayMining

:: DESCRIPTION

ArrayMining is a server for automating statistical analysis of gene and protein expression microarray data, designed as a supporting tool for investigation of the genetic components of diseases.

::DEVELOPER

ArrayMining team

:: SCREENSHOTS

N/A

:: REQUIREMENTS

  • Web Browser

:: DOWNLOAD

 NO

:: MORE INFORMATION

Citation:

BMC Bioinformatics. 2009 Oct 28;10:358. doi: 10.1186/1471-2105-10-358.
ArrayMining: a modular web-application for microarray analysis combining ensemble and consensus methods with cross-study normalization.
Glaab E, Garibaldi JM, Krasnogor N.

ReMoDiscovery – Inferring Transcriptional Module networks from ChIP-chip-, motif- and microarray data

ReMoDiscovery

:: DESCRIPTION

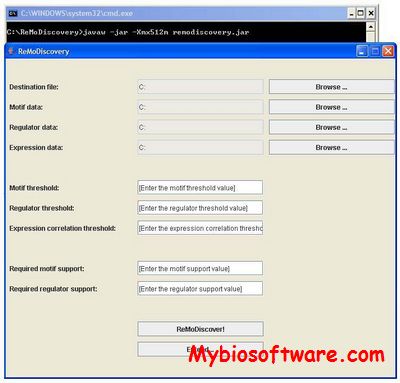
ReMoDiscovery is an intuitive algorithm to correlate regulatory programs with regulators and corresponding motifs to a set of co-expressed genes. It exploits in a concurrent way three independent data sources: ChIP-chip data, motif information and gene expression profiles.

::DEVELOPER

Kathleen Marchal 

:: SCREENSHOTS

:: REQUIREMENTS

  • Linux /  Windows / MacOsX
  • Java
:: DOWNLOAD

 ReMoDiscovery

:: MORE INFORMATION

Citation

Genome Biol. 2006;7(5):R37. Epub 2006 May 5.
Inferring transcriptional modules from ChIP-chip, motif and microarray data.
Lemmens K, Dhollander T, De Bie T, Monsieurs P, Engelen K, Smets B, Winderickx J, De Moor B, Marchal K.

GoSurfer 2.0 – Graphical Data Mining tool for Microarray data using Gene Ontology Information

GoSurfer 2.0

:: DESCRIPTION

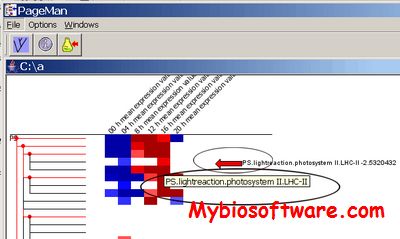
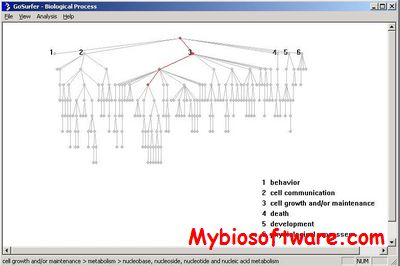
GoSurfer uses Gene Ontology (GO) information to analyze gene sets obtained from genome-wide computations or microarray analyses. GoSurfer is a graphical interactive data mining tool. It associates user input genes with GO terms and visualizes such GO terms as a hierarchical tree. Users can manipulate the tree output by various means, like setting heuristic thresholds or using statistical tests. Significantly important GO terms resulted from a statistical test can be highlighted. All related information are exportable either as texts or as graphics.

::DEVELOPER

Zhong Lab

:: SCREENSHOTS

:: REQUIREMENTS

  • Windows

:: DOWNLOAD

 GoSurfer

:: MORE INFORMATION

Citation

Zhong S, Storch F, Lipan O, Kao MJ, Weitz C, Wong WH.
GoSurfer: a graphical interactive tool for comparative analysis of large gene sets in Gene Ontology space.
Applied Bioinformatics 2004, 3(4): 1-5.

RPS 1.0 – Reproducibility Probability Score for Microarray Data

RPS 1.0

:: DESCRIPTION

RPS (Reproducibility Probability Score) computes reproducibility probability score  to select differentially expressed genes. The Reproducibility Probability Score (RPS), takes into consideration both the replicated data in a particular lab and the measurement variability across labs. The measurement variability is assessed by utilizing the reference gene expression data generated in the Microarray Quality Control (MAQC) project. Specifically, we applied the data generated across replicate gene expression analysis that was conducted in multiple facilities as part of this effort.  A larger RPS means a gene is more likely to be differentially expressed; and if similar transcription profiling measurements are made in other laboratories, it is highly likely to be confirmed.

::DEVELOPER

Zhong Lab

:: SCREENSHOTS

N/A

:: REQUIREMENTS

:: DOWNLOAD

  RPS

:: MORE INFORMATION

Citation

Guixian Lin, Xuming He, Hanlee Ji, Leming Shi, Ronald W. Davis, and Sheng Zhong.
Reproducibility Probability Score: Incorporating Measurement Variability across Laboratories for Gene Selection,
Nature Biotechnology 24, 1476 – 1477 (2006)

SKNN 1.0.1 – Sequential K-Nearest Neighbor method for Microarray data Imputation

SKNN 1.0.1

:: DESCRIPTION

SKNN (SeqKnn) imputes the missing values sequentially from the gene having least missing values, and uses the imputed values for the later imputation

:: DEVELOPER

Bioinformatics and Synthetic Biology Lab, KAIST.

:: SCREENSHOTS

N/A

:: REQUIREMENTS

  • Windows/Linux/MacOsX
  • R package

:: DOWNLOAD

 SKNN

:: MORE INFORMATION

Citation

BMC Bioinformatics. 2004 Oct 26;5:160.
Reuse of imputed data in microarray analysis increases imputation efficiency.
Kim KY, Kim BJ, Yi GS.

Genetrix 3.63 – Analysis of Microarray Data

Genetrix 3.63

:: DESCRIPTION

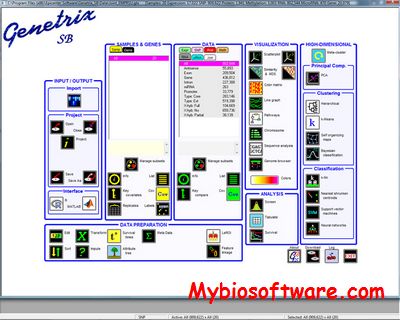
Genetrix is an next-generation software that brings the full power of proven statistical methods, powerful machine-learning heuristics and integrated biological knowledge to the analysis and interpretation of gene expression, RNA, μRNA, SNP and DNA methylation microarray experiments.

::DEVELOPER

Epicenter Software

:: SCREENSHOTS

::REQUIREMENTS

:: DOWNLOAD

 Genetrix

:: MORE INFORMATION

DetectiV 1.2 – Analysis of Pathogen Detection Microarray data

DetectiV 1.2

:: DESCRIPTION

DetectiV is a package for R containing functions for visualisation, normalisation and significance testing of pathogen detection microarray data. DetectiV uses simple and established methods for visualisation, normalisation and significance testing. When applied to a publicly available microarray dataset, DetectiV produces the correct result in 55 out of 56 arrays tested, an improvement on previously published methods.

::DEVELOPER

Michael Watson 

:: SCREENSHOTS

N/A

:: REQUIREMENTS

  • Linux / Windows / MacOsX
  • R Package

:: DOWNLOAD

 DetectiV

:: MORE INFORMATION

Citation:

DetectiV: visualization, normalization and significance testing for pathogen-detection microarray data.
Watson M, Dukes J, Abu-Median AB, King DP, Britton P.
Genome Biol. 2007;8(9):R190.

Exit mobile version