ExpressConverter is a file transformation tool that reads microarray data files in a variety of file formats and generates TIGR MultiExperiment Viewer file (.mev) as output so that the microarray data can be uploaded to the database with MADAM and analyzed with MIDAS and MEV.
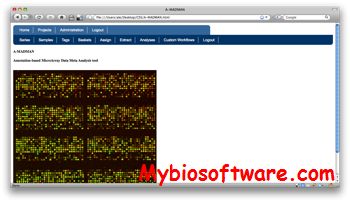
A-MADMAN (Annotation-based MicroArray DataMeta ANalysis tool) is an open source web application and gene chip analysis automation framework for annotation-based meta-analysis of data from public repositories (NCBI GEO).
ArrayPipe is a web-based or standalone tool for the processing and analysis of microarray data. It provides functions for data visualization, background correction, normalization, detections of differentially expressed genes, comparison and highlighting of gene lists, as well as web-based spreadsheets for data mining.
EVE (External Variance Estimation) is an software to detect differentially expressed genes using microarray data.You can download an R-script that works for data from the Affymetrix ATH1 GeneChip® microarray.
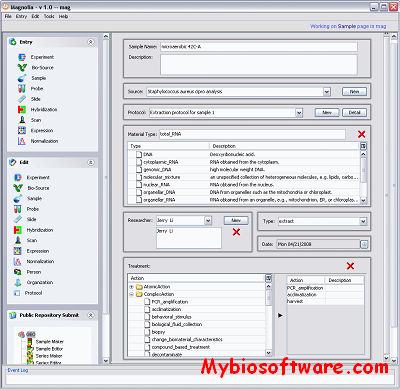
Magnolia is a microarray data management and export system for researchers who use PFGRC microarrays. Since it has been an obligation to submit microarray experiment data to public repositories for publishing the experimental results, collecting and storing the data is an essential step in microarray study. Implemented with H2 DBMS as the backend storage, Magnolia provides PFGRC array users with a series of intelligent entry form to collect the information or parameters of experiment, bio-source, sample, probe, slide, scan, expression, and normalization, which is MIAME compliant.
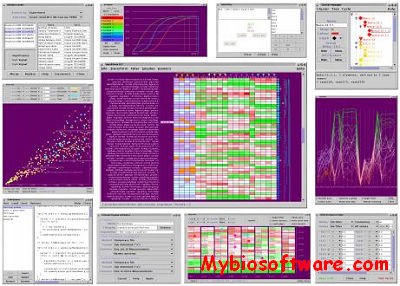
GeneXplorer is a web application for interactive microarray data visualization and analysis in a web environment. GeneXplorer allows users to browse a microarray dataset in an intuitive fashion. It provides simple access to microarray data over the Internet and uses only HTML and JavaScript to display graphic and annotation information. It provides radar and zoom views of the data, allows display of the nearest neighbors to a gene expression vector based on their Pearson correlations and provides the ability to search gene annotation fields.
ENIGMA – Expression Network Inference and Global Module Analysis. It is a software tool to analyze the modular structure of perturbational gene expression data, based on the use of combinatorial statistics and graph-based clustering. The modules are further characterized by incorporating other data types, e.g. GO annotation, protein interactions and transcription factor binding information, and by suggesting regulators that might have an effect on the expression of (some of) the genes in the module.
Steven Maere, Patrick Van Dijck, Martin Kuiper (2008) Extracting expression modules from perturbational gene expression compendia. BMC Systems Biology 2:33 (PubMed, BMC)
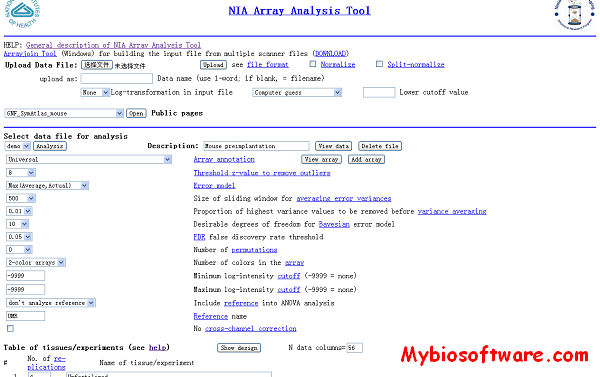
NIA Array Analysis Tool is designed to test statistical significance of gene microarray data, visualize the results, and provide links to clone information and gene index.
Evaluate the statistical significance of differential gene expression based on microarray data
Make log-ratio plots and scatter-plots
Find clusters of tissues with similar expression patterns and identify specific genes for each cluster
Find major patterns of variability in gene expression using Principal Component Analysis (PCA) and biplot
Cluster genes according to their contribution to principal components
Find genes whose expression matches a given pattern (pattern matching)
Plot the dendrogram for replications to check abnormal arrays
Plot the error function (SD vs. expression level)
Make a correlation matrix
Normalize input data
Import principal components from an earlier analysis to overlay 2 sets of results
Save results of analysis for personal or public access
Arrayjoin Tool is designed for compiling an input file from multiple scanner files.
ANOVA Tool – Statistical analysis is based on the single-factor ANalysis Of VAriance
Hierarchical clustering of tissues is done using the average distance method.
Principal component analysis (PCA) is done using the Singular Value Decomposition (SVD) method that generates eigenvectors both for rows and columns of the log-transformed data matrix (Gabriel 1971.
Pattern matching can be used to find genes with expression pattern similar to some other gene (or group of genes).
Gene list analysis – Getting information on selected genes is one of most important components of microarray analysis.