Graphite is a variant adjudication tool that aids in confirming or rejecting the presence of candidate alleles by constructing a graph using reference as well as alternate alleles.
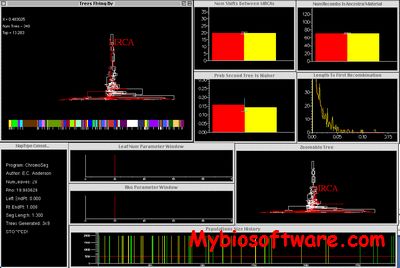
GraphDTL is the first method to infer supports for evolutionary events based on their frequencies in the set of equally parsimonious reconciliations
Given a , this program computes
GraphDNA (DNA Skew Graphing) allows the user to generate graphical representations of raw DNA sequences. To date, there are 8 graphing options and the user can plot any of the individal genes or genomes in any format
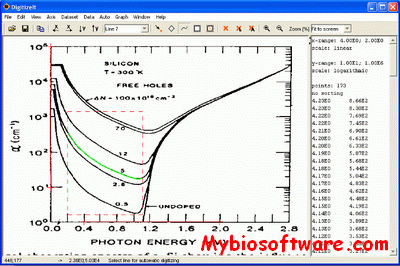
DigitizeIt digitizer software replaces a digitizer tablet. Sometimes it is necessary to extract data values from graphs, e.g. in most scientific publications only plots but no data values are published. DigitizeIt makes it easy to actually get back numbers from such a plot! This is a three step process: a) import the graph from a file or copy it over the clipboard, b) define the axes system, c) digitize it automatically or manually. Data values can then be saved in ASCII format or copy & pasted directly into any other application, e.g. MS Excel or Microcal Origin.
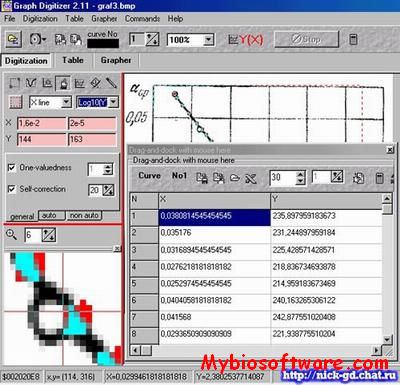
GetData Graph Digitizer is a program for digitizing graphs and plots. It is often necessary to obtain original (x,y) data from graphs, e.g. from scanned scientific plots, when data values are not available.
Graph Digitizer intends for digitization of orthogonal graphs (from book, papers). The input graph image file should be in bmp, jpg, tif or gif format. Image of the graph can be scanned or pasted from clipboard. A bad image map can be edited and rotated. A tie to real coordinates of chart implements by allocation of rectangular area and coordinates setting of two points – left-bottom and righ-top corners of this rectangle. There are three modes of digitization. Auto digitization – you define curve color and area of search (the red rectangle) and press button “Auto digitization in rectangle area”. Semi-auto digitization – when you press button “Search in area” and move cursor on (along) a curve. Manual digitization – you press button “Manual input” and click in curve, the value is recorded in the table. Data Y(X) from the Table may be displaed in Grapher or saved in data-file format.
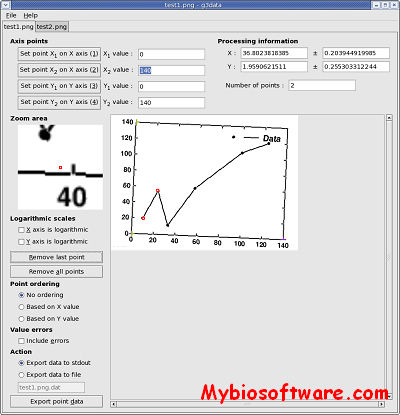
g3data is used for extracting data from graphs. In publications graphs often are included, but the actual data is missing. g3data makes the extracting process much easier.
MAGE-ML visualize script will read any MAGE-ML file and generate a graph showing the links between BioMaterials all the way through to BioAssays, and include information on sample characteristics and experimental factor values in the output.