bammds 2014 – Create MDS plot of Populations for Genetic data

bammds 2014

:: DESCRIPTION

bammds is a software that allows to create a multidimensional scaling (MDS) plot of populations for genetic data.

::DEVELOPER

bammds team

:: SCREENSHOTS

N/A

:: REQUIREMENTS

  • Linux
  • samtools
  • R
  • Perl

:: DOWNLOAD

 bammds

:: MORE INFORMATION

Citation

bammds: A tool for assessing the ancestry of low depth whole genome data using multidimensional scaling (MDS).
Malaspinas AS, Tange O, Moreno-Mayar JV, Rasmussen M, DeGiorgio M, Wang Y, Valdiosera CE, Politis G, Willerslev E, Nielsen R.
Bioinformatics. 2014 Jun 28. pii: btu410.
C-State 0.2.3 – Query and Plot Chromatin Landscapes across multiple loci and Cell Types

C-State 0.2.3

:: DESCRIPTION

C-State (Chromatin-State) is an interactive platform that enables experimentalists who lack bioinformatics support to investigate epigenetic landscapes across multiple datasets for comparative epigenomic analysis.

::DEVELOPER

Rakesh Mishra Lab

:: SCREENSHOTS

N/A

:: REQUIREMENTS

  • Linux / Windows /MacOsX

:: DOWNLOAD

C-State

:: MORE INFORMATION

Citation:

Sowpati DT, Srivastava S, Dhawan J, Mishra RK.
C-State: an interactive web app for simultaneous multi-gene visualization and comparative epigenetic pattern search.
BMC Bioinformatics. 2017 Sep 13;18(Suppl 10):392. doi: 10.1186/s12859-017-1786-6. PMID: 28929968; PMCID: PMC5606219.

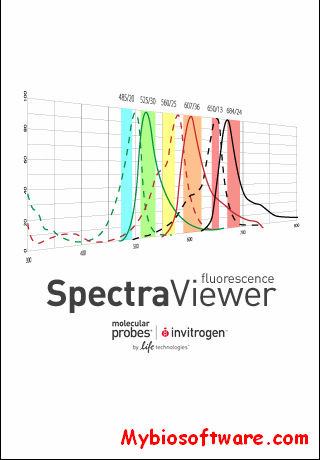
Fluorescence Spectraviewer 3.1.1 – Plot & Compare Spectra for iPhone/iPad

Fluorescence Spectraviewer 3.1.1

:: DESCRIPTION

Fluorescence Spectraviewer is a software to plot and compare spectra, check the spectral compatibility for many fluorophores and email the configuration to yourself or others in the lab in a clear printable format.

::DEVELOPER

Thermo Fisher Scientific Inc.

:: SCREENSHOTS

:: REQUIREMENTS

  • iPhone /  iPad / Java

:: DOWNLOAD

Fluorescence Spectraviewer for iPhone

:: MORE INFORMATION

BLASTPLOT 0.2 – Plot Blast Output Results

BLASTPLOT 0.2

:: DESCRIPTION

BLASTPLOT is a simple to use PERL module that allows the generation of PNG graphs for all the reference sequences associated with a BLAST result set.

::DEVELOPER

BLASTPLOT team

:: SCREENSHOTS

N/A

:: REQUIREMENTS

  • Linux
  • Perl

:: DOWNLOAD

 BLASTPLOT

:: MORE INFORMATION

Citation:

Source Code Biol Med. 2014 Mar 31;9(1):7. doi: 10.1186/1751-0473-9-7.
BLASTPLOT: a PERL module to plot next generation sequencing NCBI-BLAST results.
Herrera-Galeano JE1, Frey KG, Cer RZ, Mateczun AJ, Bishop-Lilly KA, Mokashi VP.

Kelviz v3.3.1 – Plot and Annotate Genetic data analysis results

Kelviz v3.3.1

:: DESCRIPTION

Kelviz is a graphing application designed to plot and annotate genetic data analysis results for easy review and publication. It is designed for use with Kelvin analysis results, but can make use of any data file that follows roughly the same conventions.

::DEVELOPER

Battelle Center for Mathematical Medicine

:: SCREENSHOTS

:: REQUIREMENTS

  • Linux/MacOsX
  • Python

:: DOWNLOAD

 Kelviz

:: MORE INFORMATION

Citation

Valentine-Cooper, J., et al. ”
Kelviz: A Graphing Tool For Statistical Evidence In Human Genetics.
Poster presented at: Road to Collaboration. NCH and OSU Human Genetics Community Symposium; 2014 May 20; Columbus, OH

SHiAT 1.1 – Generates Plots of Variation along Sequence Alignment

SHiAT 1.1

:: DESCRIPTION

SHiAT (Shannon Heterogeneity in Alignments Tool) provides an intuitive graphical interface for the simultaneous calculation of three measures of sitewise variation in DNA or RNA alignments. The Shannon Information index, Hamming distance and (1-consensus frequency) are all calculated and displayed in a series of graphical plots. Multiple alignments may be imported and compared, and a data view panel allows easy copy-and-pasting into external applications.

::DEVELOPER

Joe Parker

:: SCREENSHOTS

:: REQUIREMENTS

  • Windows / MacOsX / Linux
  • Java

:: DOWNLOAD

SHiAT

:: MORE INFORMATION

genoPlotR 0.8.11 – Plot Gene and Genome Maps

genoPlotR 0.8.11

:: DESCRIPTION

genoPlotR is a package for the R statistical environment that enables one to load genome alignments and comparisons along with genome annotation to create plots and diagrams of genome comparisons

::DEVELOPER

Lionel Guy (lionel.guy at ebc.uu.se), Jens Roat Kultima

:: SCREENSHOTS

N/A

:: REQUIREMENTS

:: DOWNLOAD

 genoPlotR

:: MORE INFORMATION

Citation:

Lionel Guy, Jens Roat Kultima, and Siv G. E. Andersson:
genoPlotR: comparative gene and genome visualization in R.
Bioinformatics 2010;26(18):2334-2335

ECplot v2.0 – Making Standardized Plots from large datasets for Bioinformatics Publications

ECplot v2.0

:: DESCRIPTION

ECplot is an online tool for plotting charts from large datasets. This tool supports a variety of chart types commonly used in bioinformatics publications.

::DEVELOPER

Kevin Yuk-Lap Yip

:: SCREENSHOTS

N/A

:: REQUIREMENTS

  • Linux

:: DOWNLOAD

 ECplot 

:: MORE INFORMATION

Citation

Bioinformatics. 2014 May 15;30(10):1467-8. doi: 10.1093/bioinformatics/btu038. Epub 2014 Jan 24.
ECplot: an online tool for making standardized plots from large datasets for bioinformatics publications.
Fok AC1, Mok SS, Lee SD, Yip KY.

GetData 2.26 – Digitize Graphs and Plots

GetData 2.26

:: DESCRIPTION

GetData Graph Digitizer is a program for digitizing graphs and plots. It is often necessary to obtain original (x,y) data from graphs, e.g. from scanned scientific plots, when data values are not available.

::DEVELOPER

S. Fedorov

:: SCREENSHOTS

:: REQUIREMENTS

  • Windows

:: DOWNLOAD

GetData

:: MORE INFORMATION

Exit mobile version