SRF (Spectral Repeat Finder) is a program to find repeats through an analysis of the power spectrum of a given DNA sequence. By repeat we mean the repeated occurrence of a segment of N nucleotides within a DNA sequence. SRF is an ab initio technique as no prior assumptions need to be made regarding either the repeat length, its fidelity, or whether the repeats are in tandem or not
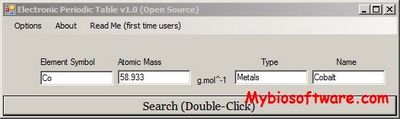
Electronic Periodic Table – simple, friendly and really handy freeware tool that lets you find and view details and properties for every chemical element.
ChIPSeqPeakFinder (ChIPSeq Peak Finder) is a tool to find peaks from ChIPSeq data generated from the Solexa / Illumina platform. Optionally, data from the peaks found can also be exported to simple textfile format for further usage.
PatMatch (Pattern Matching) allows you to search for short (<20 residues) nucleotide or peptide sequences, or ambiguous/degenerate patterns. It uses the same Arabidopsis dataset as TAIR’s BLAST and FASTA programs. If you are searching for a sequence >20 bp or aa with no degenerate positions, please use BLAST or FASTA, which are much faster. Pattern Matching allows for ambiguous characters, mismatches, insertions and deletions, but does not do alignments and so is not a replacement for BLAST and FASTA Currently the maximum number of hits retrieved is 250,000 and the minimum number of input string is 3 residues.
Glob-mapper is required to plot Event-mapper and Peak-mapper data and to extract hot spots (gene clusters) from the Event maps. Glob-mapper will search for the input data in a directory with pre-computed *.dat and *.sgn files generated by Event- or Peak-mapper, Glob-mapper also requires an identification file, containing genes ID and other information (a sample file is provided). This information will be displayed for the extracted genes. The ID file must contain at least three columns of data: 1 – unique profile identifier, 2 – gene identifier or CG number, this information will be extracted, 3 (must be the last column) – user-defined score value, this value is used to display a subset of the entire data on Event maps. Using this value user can, for instance, display all genes of a given pathway, which may serve as a marker in the analysis of the global gene expression.
Peak-mapper is the program to identify local differences (disconcordances) in gene expression after aligning orthologous data sets. The program takes two aligned microarray datasets (*.aln) as an input and returns a map similar to that of Event-mapper, where peaks (hot spots) correspond to gene batteries having similar disconcordances between two organisms.