waviCGH – Server Application for the Analysis and Visualization of Array-CGH data

waviCGH

:: DESCRIPTION

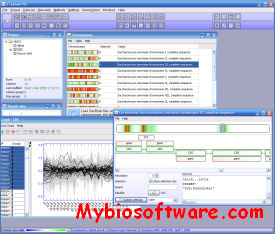
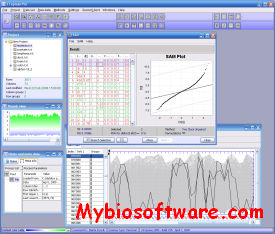
waviCGH is a versatile web-server application for the analysis and visualization of array-CGH data. With waviCGH you can upload and process Log Ratios or Copy Numbers.waviCGH includes methods for pre-processing of the data, segmentation, calling of gains and losses, and minimal common regions determination over a set of experiments.

::DEVELOPER

 Bioinfo Unit@CNIO

:: SCREENSHOTS

:: REQUIREMENTS

  • Web Browser

:: DOWNLOAD

   No, Only Web Service

:: MORE INFORMATION

Citation

Angel Carro; Daniel Rico; Oscar M. Rueda; Ramon Diaz-Uriarte; David G. Pisano.
waviCGH: a web application for the analysis and visualization of genomic copy number alterations.
Nucleic Acids Research 2010; doi: 10.1093/nar/gkq441

VAMPIRE – Interpret Microarray Gene Expression Data

VAMPIRE

:: DESCRIPTION

VAMPIRE (variance-modeled posterior inference with regional exponentials) was originally developed to interpret one-channel microarray data, such as Affymetrix oligonucleotide arrays. Given a summary measure of gene expression, such as the Affymetrix MAS 5.0 scores for each microarray feature (or probe set), it determines the optimal variance model parameters for a two-component variance model. The expression-independent variance represents a constant “background” noise that affects all array features to the same extent, while the expression-dependent variance represents a proportional noise that increases with gene expression. Low-intensity features thus have larger proportional of noise, because of the influence of expression-independent variance. With this optimized model, VAMPIRE then computes a Bayesian statistical test to determine whether observed changes in intensity are statistically significant.

::DEVELOPER

Subramaniam Lab

:: SCREENSHOTS

N/A

:: REQUIREMENTS

  • Linux / Windows /MacOsX
  • Java

:: DOWNLOAD

 VAMPIRE

:: MORE INFORMATION

Citation

Albert Hsiao, Trey Ideker, Jerrold M. Olefsky and Shankar Subramaniam
VAMPIRE microarray suite: a web-based platform for the interpretation of gene expression data
Nucleic Acids Research 33 (suppl 2): W627-W632.

Prometheus 0.8.0 – Storage, Management, and Analysis of Fermentation data

Prometheus 0.8.0

:: DESCRIPTION

Prometheus is a versatile software platform for the storage, management, and analysis of fermentation data. The multi application system allows storing of arbitrary online and offline parameters and supports gene expression studies by including existing applications for microarray and qPCR analysis. The newly developed application Prometheus features data import, runtime chart generation, data statistics, and a versatile data export mechanism. The platform can be accessed using a web browser and exposes many functions as a web service. The complete system is protected by a user management system providing single sign on and fine grained data sharing mechanisms.

::DEVELOPER

Genomics & Bioinformatics Graz, Graz University of Technology

:: SCREENSHOTS

:: REQUIREMENTS

  • Linux / Windows / MacOsX
  • Java
  • Oracle / PostgreSQL / MySQL

:: DOWNLOAD

 Prometheus

:: MORE INFORMATION

Citation

Rader R, Pabinger S, Specht T, Ramsauer T, Trajanoski Z.
Prometheus: Integrating bioprocess and gene expression data for industrial bioprocess optimization.
submitted

AffyGCQC 1.02 – GeneChip Data Quality Control

AffyGCQC 1.02

:: DESCRIPTION

AffyGCQC is the acronym for a bioinformatics tool designed to perform Affymetrix GeneChip Quality Control. This program implements a graphical representation of QC metrics recommended by Affymetrix for GeneChip oligonucleotide array technology. Most importantly, it performs extreme studentized deviate statistical tests for the set of arrays being compared in a given experiment, thus providing an objective measure for outlier detection.

DEVELOPER

Osorio Y Fortéa J, Prina E, Lang T, Milon G, Davory C, Coppée JY, Regnault B.

:: SCREENSHOTS

N/A

:: REQUIREMENTS

  • Windows / Linux / MacOsX
  • Apache
  • R Package
  • Perl

:: DOWNLOAD

 AffyGCQC

:: MORE INFORMATION

Citation

J Bioinform Comput Biol. 2008 Apr;6(2):317-34.
AffyGCQC: a web-based interface to detect outlying genechips with extreme studentized deviate tests.
Osorio Y Fortéa J, Prina E, Lang T, Milon G, Davory C, Coppée JY, Regnault B.

J-Express 2012 – Analysis and Visualization of Microarray Data

J-Express 2012

:: DESCRIPTION

J-Express is a comprehensive portable software package for analysis and visualization of microarray data. The software gives access to methods for unsupervised analysis (clustering etc.), supervised analysis (SAM, Feature Subset Selection, etc.) and visualisation in an integrated and flexible way. Its efficiency allows interactive clustering of thousands of expression profiles on standard personal computers. Supervised analysis can be performed on samples by simple user-guided sample annotation or on genes through tools for metabolic pathway analysis and Gene Ontology mapping.

J-Express contains many analysis methods and data preparation tools to make the most of your data. Image analysis files can be easily prepared (normalized etc.) and combined for downstream analysis. Supervised methods can discover patterns in the data and reveal genes or gene groups (such as gene ontology groups or metabolic pathways) differentially expressed between samples. unsupervised methods can organize the data and discover patterns, or reveal underlying biological functions such as co-regulation.

Features

  • New analysis methods
  • Genset enrichment analysis (GSEA)
  • Chromosome (DNA sequence) mapping and analysis
  • Gaussian kernels
  • Cross-data class prediction
  • Linear and symmetric color table support
  • Faster dataset repository access
  • Simple embedded resource download
  • Native look and feel

::DEVELOPER

Molmine AS

:: SCREENSHOTS

:: REQUIREMENTS

  • Multiplatform
  • Java 6.0 runtime environment.(see www.java.com)

:: DOWNLOAD

J-Express

:: MORE INFORMATION

Most of the advanced features in J-Express are locked when no license is applied. Read more about License package details. Purchase J-Express Licenses.

GQL 1.0 – GHMM-based tool for Querying and Clustering Gene-Expression time-course data

GQL 1.0

:: DESCRIPTION

GQL (Graphical Query Language) is a suite of tools for analyizing time-course experiments. Currently, it is adapted to gene expression data. The two main tools are GQLQuery, for querying data sets, and GQLCluster, which provides a way for computing groupings based on a number of methods (model-based clustering using HMMs as cluster models and estimation of a mixture of HMMs).

::DEVELOPER

Alexander Schliep’s group for bioinformatics

:: SCREENSHOTS

N/A

:: REQUIREMENTS

:: DOWNLOAD

 GQL

:: MORE INFORMATION

Citation

Bioinformatics. 2005 May 15;21(10):2544-5. Epub 2005 Feb 8.
The Graphical Query Language: a tool for analysis of gene expression time-courses.
Costa IG, Schönhuth A, Schliep A.

FunCluster 1.07 – Functional Analysis of Gene Expression data

FunCluster 1.07

:: DESCRIPTION

FunCluster is a genomic data analysis tool designed to perform a functional analysis of gene expression data obtained from cDNA microarray experiments. Besides automated functional annotation of gene expression data, FunCluster functional analysis allows to detect co-regulated biological processes (i.e. represented by annotating genomic themes) through a specifically designed co-clustering procedure involving biological annotations and gene expression data. FunCluster’s functional analysis relies on Gene Ontology and KEGG annotations and is currently available for three organisms: Homo sapiens, Mus musculus and Saccharomyces cerevisiae.

::DEVELOPER

 Corneliu Henegar

:: SCREENSHOTS

N/A

:: REQUIREMENTS

:: DOWNLOAD

  FunCluster

:: MORE INFORMATION

Citation

Clustering biological annotations and gene expression data to identify putatively co-regulated biological processes
Henegar C, Cancello R, Rome S, Vidal H, Clement K, Zucker JD
J Bioinform Comput Biol. 2006 Aug;4(4):833-52.


PyParaTools – Software for working with paramagnetic NMR data

PyParaTools

:: DESCRIPTION

PyParaTools is a Python based software package for analysing Pseudocontact Shift, Paramagnetic Relaxation Enhancement and Residual Dipolar Coupling data. Such data is readily acquired from paramagnetic Nuclear Magnetic Resonance experiments and provides rich, long-range, distance and, or, orientational structural restraints.

::DEVELOPER

The Biomolecular Modeling & Computational Biology Group

:: SCREENSHOTS

N/A

:: REQUIREMENTS

  • Linux / MacOsX / Windows
  • Python

:: DOWNLOAD

 PyParaTools

:: MORE INFORMATION

Author tool 4.0 – Input data into Reactome

Author tool 4.0

:: DESCRIPTION

The Author tool is designed for biologists to input data into Reactome (an open-source, open access, manually curated and peer-reviewed pathway database.)

::DEVELOPER

Reactome Team

:: SCREENSHOTS

:: REQUIREMENTS

  • Windows / Linux/  MacOSX
  • Java

:: DOWNLOAD

 Author tool

:: MORE INFORMATION

Citation


qPCR-DAMS 1.2 – Analyze, Manage, and Store Quantitative Real-Time PCR data.

qPCR-DAMS 1.2

:: DESCRIPTION

qPCR-DAMS is a database management system implemented on MS Access 2003 and Visual Basic. It is designed to analyze, manage, and store relative and absolute quantitative real-time PCR data. The system consists of 5 blocks: three blocks (Gene, Plate, and Experiment) for inputting, storing and describing raw data, and two blocks (View data and Process Data) for checking, evaluating, and processing data. Users are allowed to choose among four basic outputs: (I) Ratio relative quantification, (II) Absolute level, (III) Normalized absolute expression, and (IV) Ratio absolute quantification, and two advanced options: (V) Multiple reference relative quantification and (VI) Multiple references absolute quantification, within single software package. The coefficient of variation is monitored at each step during data processing and the accuracy is further improved by an easy data tracking and display system. In summary, qPCR-DAMS is a handy novel tool for real-time PCR users.

::DEVELOPER

Nili Jin , Keyu He and Lin Liu

:: SCREENSHOTS

N/A

:: REQUIREMENTS

  • Windows
  • Microsoft Access 2000 or above

:: DOWNLOAD

 qPCR-DAMS

:: MORE INFORMATION

Citation

Nili Jin , Keyu He and Lin Liu
qPCR-DAMS: a database tool to analyze, manage, and store both relative and absolute quantitative real-time PCR data
Physiological Genomics 25:525-527 (2006)

Exit mobile version