VitaPad 0.6.1c – Visualize and Analyze Biological Pathways

VitaPad 0.6.1c

:: DESCRIPTION

VitaPad is an application used to visualize biological pathways and map experimental data to them

::DEVELOPER

Zhao Hongyu’s Lab

:: SCREENSHOTS

VitaPad

:: REQUIREMENTS

  • Windows/ Linux/MacOsX
  • Java

:: DOWNLOAD

  VitaPad

:: MORE INFORMATION

Citation

VitaPad: visualization tools for the analysis of pathway data.
Holford M, Li N, Nadkarni P, Zhao H.
Bioinformatics. 2005 Apr 15;21(8):1596-602. Epub 2004 Nov 25.

BALM 1.0.1 – Analyze MBD-seq

BALM 1.0.1

:: DESCRIPTION

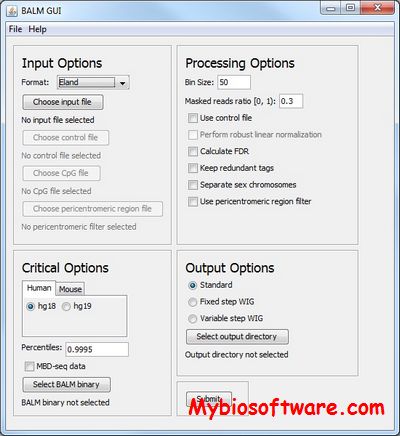
BALM ( bi-asymmetric-Laplace model) was developed to analyze MBD-seq. We compared the resolution of BALM to that of several ChIP-seq analysis tools. The results demonstrate the program’s superior ability to distinguish methylation statuses of closely positioned CpG sites. This study demonstrates that MBD-seq combined with the new program is potentially a powerful tool to capture genome-wide DNA methylation profiles with high efficiency and resolution.

::DEVELOPER

Jin Lab

:: SCREENSHOTS

:: REQUIREMENTS

  • Windows/Linux/MacOsX
  • Java

:: DOWNLOAD

  BALM

:: MORE INFORMATION

Citation

Lan X, Adams C, Landers M, Dudas M, Krissinger D, et al. (2011)
High Resolution Detection and Analysis of CpG Dinucleotides Methylation Using MBDSeq Technology.
PLoS ONE 6(7): e22226. doi:10.1371/journal.pone.0022226

FlowAnd 1.0 – Analyze Largescale, Multi-color Flow Cytometry data

FlowAnd 1.0

:: DESCRIPTION

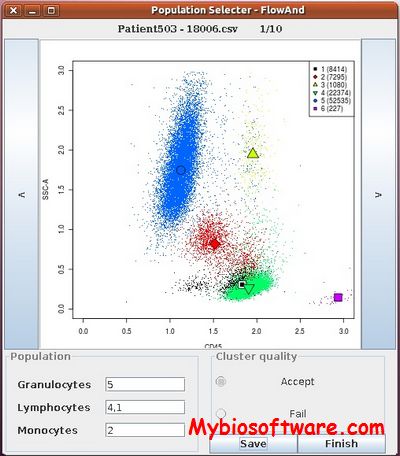
FlowAnd is designed to analyze and integrate largescale, multi-color flow cytometry data. It implements methods for data importing, various transformations, several clustering algorithms for automatic clustering, visualization tools as well as straightforward statistical testing.

::DEVELOPER

Hautaniemi Lab

:: SCREENSHOTS

:: REQUIREMENTS

:: DOWNLOAD

 FlowAnd

:: MORE INFORMATION

Citation

Lahesmaa-Korpinen AM, Jalkanen SE, Chen P, Valo E, Nú?ez- Fontarnau J, et al. (2011)
FlowAnd: Comprehensive Computational Framework for Flow Cytometry Data Analysis
J Proteomics Bioinform 4: 245-249. doi:10.4172/ jpb.1000197

HTSeq 0.13.5 – Process and Analyze data from High-throughput Sequencing (HTS) Assays

HTSeq 0.13.5

:: DESCRIPTION

HTSeq is a Python package that provides infrastructure to process data from high-throughput sequencing assays.

::DEVELOPER

Huber Group

:: SCREENSHOTS

N/A

:: REQUIREMENTS

:: DOWNLOAD

 HTSeq

:: MORE INFORMATION

Citation

HTSeq–a Python framework to work with high-throughput sequencing data.
Anders S, Pyl PT, Huber W.
Bioinformatics. 2015 Jan 15;31(2):166-9. doi: 10.1093/bioinformatics/btu638.

Trans-ABySS 2.0.1 – Analyze ABySS multi-k-assembled Shotgun Transcriptome Data.

Trans-ABySS 2.0.1

:: DESCRIPTION

Trans-ABySS is a software pipeline for analyzing ABySS-assembled contigs from shotgun transcriptome data. The pipeline accepts assemblies that were generated across a wide range of k values in order to address variable transcript expression levels. It first filters and merges the multi-k assemblies, generating a much smaller set of nonredundant contigs. It contains scripts that map assembled contigs to known transcripts, currently supporting Blat and Exonerate contig-to-genome aligners. It identifies novel splicing events like exon-skipping, novel exons, retained introns, novel introns, and alternative splicing. Its scripts can also estimate gene expression levels, identify candidate polyadenylation sites, and identify candidate gene-fusion events.

::DEVELOPER

Canada’s Michael Smith Genome Sciences Centre

:: SCREENSHOTS

N/A

:: REQUIREMENTS

:: DOWNLOAD

  Trans-ABySS

:: MORE INFORMATION

Citation

Robertson G, Schein J, Chiu R, Corbett R, Field M, Jackman SD, Mungall K, Lee S, Okada HM, Qian JQ, Griffith M, Raymond A, Thiessen N, Cezard T, Butterfield YS, Newsome R, Chan SK, She R, Varhol R, Kamoh B, Prabhu AL, Tam A, Zhao Y, Moore RA, Hirst M, Marra MA, Jones SJ, Hoodless PA, Birol I.
De novo assembly and analysis of RNA-seq data.
Nat Methods. 2010 Nov;7(11):909-12. Epub 2010 Oct 10.

chromEvol 2.0 – Analyze Changes in Chromosome-number along a Phylogeny

chromEvol 2.0

:: DESCRIPTION

 chromEvol is a program for analyzing changes in chromosome-number along a phylogeny and for the inference of polyploidy.

::DEVELOPER

Mayrose Lab

:: SCREENSHOTS

N/A

:: REQUIREMENTS

  • Windows/ Linux

:: DOWNLOAD

   chromEvol

:: MORE INFORMATION

Citation

Mayrose I, Barker MS, Otto SP. 2010.
Probabilistic models of chromosome number evolution and the inference of polyploidy.
Systematic Biology. 59(2):132-144

STAMP 2.1.3 – Analyze Metagenomic Profiles

STAMP 2.1.3

:: DESCRIPTION

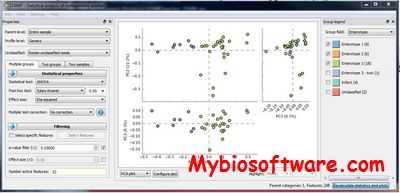
STAMP (Statistical Analysis of Metagenomic Profiles) is a software package for analyzing metagenomic profiles (e.g., a taxonomic profile indicating the number of marker genes assigned to different taxonomic units or a functional profile indicating the number of sequences assigned to different biological subsystems or pathways) that promotes ‘best practices’ in choosing appropriate statistical techniques and reporting results. It encourages the use of effect sizes and confidence intervals in assessing biological importance. A user friendly, graphical interface permits easy exploration of statistical results and generation of publication quality plots for inferring the biological relevance of features in a metagenomic profile.

::DEVELOPER

Beiko lab

:: SCREENSHOTS

:: REQUIREMENTS

  • Windows / Mac OsX / Linux

:: DOWNLOAD

 STAMP

:: MORE INFORMATION

Citation

STAMP: statistical analysis of taxonomic and functional profiles.
Parks DH, Tyson GW, Hugenholtz P, Beiko RG.
Bioinformatics. 2014 Jul 23. pii: btu494.

Parks, D.H. and Beiko, R.G. (2010).
Identifying biologically relevant differences between metagenomic communities.
Bioinformatics, 26, 715-721.

DE-SAGE – Analyze SAGE Library data

DE-SAGE

:: DESCRIPTION

DE-SAGE analyzes SAGE library data using a Bayesian hierachical and mixture modeling approach and RJMCMC computational algorithms.

::DEVELOPER

Statistical Genetics and Bioinformatics Group

:: SCREENSHOTS

N/A

:: REQUIREMENTS

  • Linux / Windows / MacOsX
  • MATLAB

:: DOWNLOAD

 DE-SAGE

:: MORE INFORMATION

Citation

Wang, Z., Lin, S., Popesco, M., and Rotter, A. (2006)
Modeling and Analysis of Multi-library, Multi-group SAGE Data with Application to a Study of Mouse Cerebellum.
Biometrics, 63, 777-786.

PhylochipAnalyzer 1.0 – Analyse Hierarchical Probe sets

PhylochipAnalyzer 1.0

:: DESCRIPTION

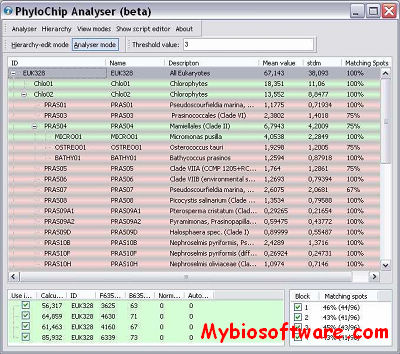
PhylochipAnalyzer is a Windows-program for the analysis of experiments with hierarchical probe-sets. It operates in two modes: first, the hierarchy of probes is defined interactively, second, the intensity data of a hybridized chip is loaded and analyzed according to the hierarchy. The program can export hierarchy trees to Newick-format and analyzed data to Excel. It contains a Delphi-script that makes it configurable with respect to different criteria for positive signals.

::DEVELOPER

Bioinformatics at AWI

:: SCREENSHOTS

:: REQUIREMENTS

  • Windows

:: DOWNLOAD

PhylochipAnalyzer

:: MORE INFORMATION

Citation:

Metfies K, Borsutzki P, Gescher C, Medlin LK, Frickenhaus S
Phylochipanalyser — a program for analysing hierarchical probe sets
Molecular Ecology Resources (2008) 8, 99–102
doi:10.1111/j.1471-8286.2007.01927.x

DisGeNET 6.0 / DisGeNET2R 0.99.0 – Query and Analyze a Network representation of human Gene-disease databases

DisGeNET 6.0 / DisGeNET2R 0.99.0

:: DESCRIPTION

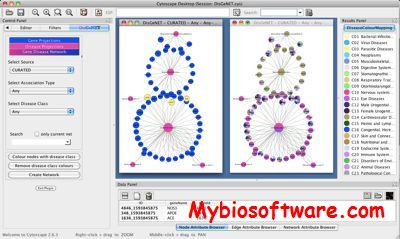
DisGeNET is a plugin for Cytoscape to query and analyze a network representation of human gene-disease databases. For this purpose, we have developed a new gene-disease database integrating data from several public sources. DisGeNET allows user-friendly access to our database, which includes queries restricted to (i) the original data source, (ii) the association type, (iii) the disorder class of interest and (iv) specific diseases, respectively genes. It represents gene-disease associations in terms of bipartite graphs and additionally provides gene centric and disease centric views of the data. It assists the user in the interpretation and exploration of human complex diseases with respect to their genetic origin by a variety of built-in functions. Moreover, DisGeNET permits multicoloring of nodes (genes/diseases) according to their disease classes for expedient visualization

DisGeNET2R contains a series of functions to retrieve and expand gene-disease, and variant-disease data, and to perform mappings of several biomedical vocabularies.

::DEVELOPER

The Integrative Biomedical Informatics group

:: SCREENSHOTS

:: REQUIREMENTS

  • Linux/windows/MacOsX
  • Java / R
  • Cytoscape

:: DOWNLOAD

  DisGeNET / DisGeNET2R

:: MORE INFORMATION

Citation

The DisGeNET knowledge platform for disease genomics: 2019 update.
Piñero J, Ramírez-Anguita JM, Saüch-Pitarch J, Ronzano F, Centeno E, Sanz F, Furlong LI.
Nucleic Acids Res. 2019 Nov 4. pii: gkz1021. doi: 10.1093/nar/gkz1021.

Anna Bauer-Mehren; Michael Rautschka; Ferran Sanz; Laura I. Furlong:
DisGeNET – a Cytoscape plugin to visualize, integrate, search and analyze gene-disease networks.
Bioinformatics, Vol. 26, No. 22. (15 November 2010), pp. 2924-2926.

Exit mobile version