BHC 1.1.0 – Bayesian Hierarchical Clustering for R

BHC 1.1.0

:: DESCRIPTION

BHC is an R/Bioconductor port of the fast novel algorithm for Bayesian agglomerative hierarchical clustering.

::DEVELOPER

Warwick Systems Biology Centre

:: SCREENSHOTS

N/A

::REQUIREMENTS

  • Windows/Linux/ MacOsX
  • R package

:: DOWNLOAD

 BHC

:: MORE INFORMATION

Citation

BMC Bioinformatics 2009, 10:242
R/BHC: fast Bayesian hierarchical clustering for microarray data
Richard S Savage et al.

HitSeekR – High-Throughput Screening Kit for R

HitSeekR

:: DESCRIPTION

HitSeekR is a web platform for analyzing high-throughput screening (HTS) data of various types, from miRNA (inhibitor) screens and RNAi assays to CRISPER/cas9 and drug response screens. It can accommodate, normalize, etc. small to ultra-large scale, and it turns your HTS data into a systems biology story.

::DEVELOPER

Baumbach lab

:: SCREENSHOTS

N/A

:: REQUIREMENTS

  • Linux / Windows / MacOsX
  • R

:: DOWNLOAD

HitSeekR

:: MORE INFORMATION

Citation

Comprehensive analysis of high-throughput screens with HiTSeekR.
List M, Schmidt S, Christiansen H, Rehmsmeier M, Tan Q, Mollenhauer J, Baumbach J.
Nucleic Acids Res. 2016 Aug 19;44(14):6639-48. doi: 10.1093/nar/gkw554


SPRINT 1.0.7 – Parallel Framework for R

SPRINT 1.0.7

:: DESCRIPTION

SPRINT (Simple Parallel R INTerface) is a parallel framework for R. It provides an easy access to high performance computing for the analysis of high throughput post genomic data using the statistical programming language R.

::DEVELOPER

SPRINT Team <sprint@ed.ac.uk>, EPCC, The University of Edinburgh,

:: SCREENSHOTS

N/A

::REQUIREMENTS

  • Linux/ MacOsX
  • R package

:: DOWNLOAD

 SPRINT

:: MORE INFORMATION

Citation

SPRINT: a new parallel framework for R.
Hill J, Hambley M, Forster T, Mewissen M, Sloan TM, Scharinger F, Trew A, Ghazal P.
BMC Bioinformatics. 2008 Dec 29;9:558. doi: 10.1186/1471-2105-9-558.

SyBiL 2.1.5 / sybilSBML 3.0.5 / sybilFCF 0.2.1 – Systems Biology Library for R

SyBiL 2.1.5 / sybilSBML 3.0.5 / sybilFCF 0.2.1

:: DESCRIPTION

The package SyBiL is a Systems Biology Library for R, implementing algorithms for constraint based analyses of metabolic networks.

The R-package sybilSBML provides support for models written in SBML format.

The R-package sybilFCF computes extreme pathways and coupled reaction sets.

::DEVELOPER

Computational Cell Biology,   Heinrich-Heine-Universität Düsseldorf

:: SCREENSHOTS

N/A

:: REQUIREMENTS

:: DOWNLOAD

 SyBiL / sybilSBML  / sybilFCF

:: MORE INFORMATION

Citation

BMC Syst Biol. 2013 Nov 13;7:125. doi: 10.1186/1752-0509-7-125.
Sybil–efficient constraint-based modelling in R.
Gelius-Dietrich G, Desouki AA, Fritzemeier CJ, Lercher MJ.

RSVSim 1.24.0 – an R/Bioconductor package for the Simulation of Structural Variations

RSVSim 1.24.0

:: DESCRIPTION

RSVSim is a package for the simulation of deletions, insertions, inversion, tandem-duplications and translocations of various sizes in any genome available as FASTA-file or BSgenome data package. SV breakpoints can be placed uniformly accross the whole genome, with a bias towards repeat regions and regions of high homology (for hg19) or at user-supplied coordinates.

::DEVELOPER

 Christoph Bartenhagen <christoph.bartenhagen at uni-muenster.de>

:: SCREENSHOTS

N/A

:: REQUIREMENTS

  • Linux/Windows/ MacOsX
  • R
  • BioCOnductor

:: DOWNLOAD

 RSVSim

:: MORE INFORMATION

Citation

Bioinformatics. 2013 Jul 1;29(13):1679-81. doi: 10.1093/bioinformatics/btt198. Epub 2013 Apr 25.
RSVSim: an R/Bioconductor package for the simulation of structural variations.
Bartenhagen C, Dugas M.

RReportGenerator 1.3.3 – Run Routine Statistical Analysis using R

RReportGenerator 1.3.3

:: DESCRIPTION

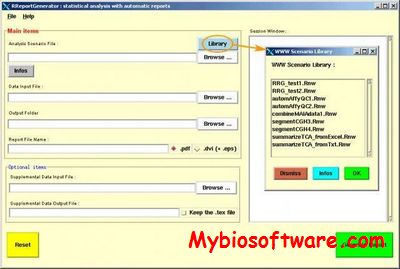
RReportGenerator provides a simple and user-friendly graphical user interface (GUI) allowing to run routine statistical analysis using R via predefined analysis scenarios in a local and independent manner. Of course, the large variety of additional libraries on CRAN and Bioconductor may be used with the analysis scenarios. The results (text, figures and tables) are automatically assembled into a report in pdf- (or dvi) format. This may be accompanied by an additional file(s) for exporting (specific) results to other applications (spread-sheet programs, web-browser etc).

::DEVELOPER

Wolfgang Raffelsberger at LBGI : Laboratoire de bioinformatique et de génomique intégratives

:: SCREENSHOTS

RReportGenerator

:: REQUIREMENTS

  • Linux/ Windows
  • R package

:: DOWNLOAD

 RReportGenerator

:: MORE INFORMATION

Citation:

Bioinformatics. 2008 Jan 15;24(2):276-8. Epub 2007 Nov 24.
RReportGenerator: automatic reports from routine statistical analysis using R.
Raffelsberger W, Krause Y, Moulinier L, Kieffer D, Morand AL, Brino L, Poch O.

Funmap 2.2.1 – Functional Mapping Package for R

Funmap 2.2.1

:: DESCRIPTION

The Funmap package is developed to identify quantitative trait loci (QTL) for a longitudinal, or vectorized, phenotypic trait as based on the Funmap model

::DEVELOPER

Center for Statistical Genetics, Penn State University

:: SCREENSHOTS

N/A

:: REQUIREMENTS

  • Windows /Linux/ MacOsX
  • R package

:: DOWNLOAD

 Funmap

:: MORE INFORMATION

Citation

Ma, C. X., G. Casella, and R. L. Wu, 2003.
Functional mapping of quantitative trait loci underlying the character process: A theoretical framework.
Genetics 161(4): 1751-1762.

R/fGWAS 2.0 – Functional GWAS package for R

R/fGWAS 2.0

:: DESCRIPTION

The R/fGWAS2 (Functional Genome-wide Association Studies) is developed as a new package for genome-wide association studies based on a single SNP analysis . It provides three separate methods.

::DEVELOPER

Center for Statistical Genetics, Penn State University

:: SCREENSHOTS

N/A

:: REQUIREMENTS

  • Windows /Linux/ MacOsX
  • R package

:: DOWNLOAD

 R/fGWAS2

:: MORE INFORMATION

Citation

Jiahan Li, Kiranmoy Das, Guifang fu, Runze Li and Rongling Wu.
The Bayesian Lasso for Genome-wide Associations Studies.
Bioinformatics (2011) 27 (4): 516-523. doi:

CARMAweb 1.3 – R- and Bioconductor-based web service for Microarray Data Analysis

CARMAweb 1.3

:: DESCRIPTION

CARMAweb (Comprehensive R-based Microarray Analysis web service) is a web application designed for the analysis of microarray data. CARMAweb performs data preprocessing (background correction, quality control and normalization), detection of differentially expressed genes, cluster analysis, dimension reduction and visualization, classification, and Gene Ontology-term analysis. This web application accepts raw data from a variety of imaging software tools for the most widely used microarray platforms: Affymetrix GeneChips, spotted two-color microarrays and Applied Biosystems (ABI) microarrays.

::DEVELOPER

Genomics & Bioinformatics Graz, Graz University of Technology

:: SCREENSHOTS

N/A

:: REQUIREMENTS

:: DOWNLOAD

 CARMAweb

:: MORE INFORMATION

Citation

Rainer J., Sanchez-Cabo F., Stocker G., Sturn A. and Trajanoski Z.
CARMAweb: comprehensive R- and Bioconductor-based web service for microarray data analysis
Nucleic Acids Research, 2006 vol 34(Web Server Issue):W498-503.

ClashScore 1.1 – R Script for VTF Percentile Plot

ClashScore 1.1

:: DESCRIPTION

ClashScore generate a percentile plot of ClashScore versus Resolution like that found in the X-Ray Verification Task Force’s recommendation to wwPDB.

::DEVELOPER

Richardson Lab

:: SCREENSHOTS

Command Line

:: REQUIREMENTS

:: DOWNLOAD

ClashScore

:: MORE INFORMATION

ClashScore is free software available under the terms of its own BSD-style license.

Exit mobile version