ViSEN 1.0beta0.3 – Visualization tool for Statistical Epistasis Networks

ViSEN 1.0beta0.3

:: DESCRIPTION

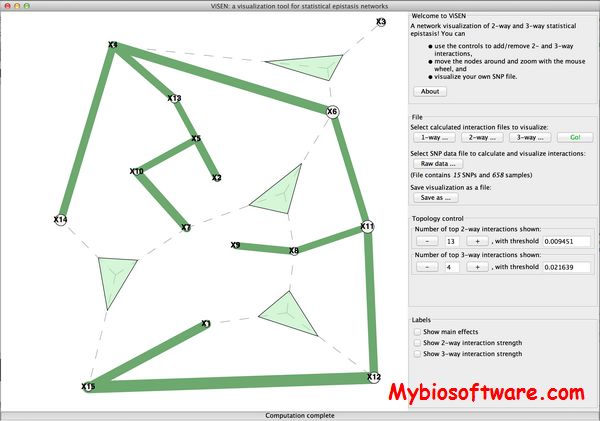
ViSEN provides a graphical visualization for statistical epistasis.  Pairwise and three-way epistatic interactions are measured using information gain and are represented using networks.

::DEVELOPER

ViSEN team

:: SCREENSHOTS

ViSEN

:: REQUIREMENTS

  • Windows/Linux/MacOsX
  • Java

:: DOWNLOAD

 ViSEN

:: MORE INFORMATION

Citation

Genet Epidemiol. 2013 Apr;37(3):283-5. doi: 10.1002/gepi.21718. Epub 2013 Mar 6.
ViSEN: methodology and software for visualization of statistical epistasis networks.
Hu T, Chen Y, Kiralis JW, Moore JH.

Genonets 201805 – Analysis and Visualization of Genotype Networks

Genonets 201805

:: DESCRIPTION

Genonets Server is a tool that provides the following features: (i) the construction of genotype networks for categorical and univariate phenotypes from DNA, RNA, amino acid or binary sequences; (ii) analyses of genotype network topology and how it relates to robustness and evolvability, as well as analyses of genotype network topography and how it relates to the navigability of a genotype network via mutation and natural selection; (iii) multiple interactive visualizations that facilitate exploratory research and education.

::DEVELOPER

:: SCREENSHOTS

N/A

:: REQUIREMENTS

  • Web browser

:: DOWNLOAD

 NO

:: MORE INFORMATION

Citation

Genonets server-a web server for the construction, analysis and visualization of genotype networks.
Khalid F, Aguilar-Rodríguez J, Wagner A, Payne JL.
Nucleic Acids Res. 2016 Apr 22. pii: gkw313.

NEST 1.0 – Network Essentiality Scoring Tool

NEST 1.0

:: DESCRIPTION

The NEST is designed to predict the gene essentiality based on protein interaction network and gene expression or CRISPR screen results.

::DEVELOPER

X. Shirley Liu Lab

:: SCREENSHOTS

N/A

:: REQUIREMENTS

  • Linux / MacOsX

:: DOWNLOAD

 NEST

:: MORE INFORMATION

Citation

Network analysis of gene essentiality in functional genomics experiments.
Jiang P, Wang H, Li W, Zang C, Li B, Wong YJ, Meyer C, Liu JS, Aster JC, Liu XS.
Genome Biol. 2015 Oct 30;16:239. doi: 10.1186/s13059-015-0808-9.

Arete 4.0 – An Analysis Toolkit for Network-based Gene Prioritisation

Arete 4.0

:: DESCRIPTION

Arete is an analysis toolkit for network-based gene prioritisation

::DEVELOPER

Laboratory for Medical Science Mathematics

:: SCREENSHOTS

:: REQUIREMENTS

  • Windows/Linux/MacOsX
  • JRE
  • Cytoscape

:: DOWNLOAD

 Arete

:: MORE INFORMATION

Citation

BioData Min. 2017 Jul 6;10:22. doi: 10.1186/s13040-017-0141-9.
Arete – candidate gene prioritization using biological network topology with additional evidence types.
Lysenko A, Boroevich KA, Tsunoda T.

VANTED 2.6.5 – Visualization and Analysis of Networks containing Experimental Data

VANTED 2.6.5

:: DESCRIPTION

VANTED (Visualisation and Analysis of Networks containing Experimental Data) is an open source software that offers the possibility to load and edit graphs, which may represent biological pathways or functional hierarchies. It allows to integrate different *omics data into the functional context and provides a variety of functions for data mapping and processing, statistical analysis, and visualisation. With the VANTED Add-on interface it is easily possible to extend the functionality of the software.

::DEVELOPER

Life Science Informatics – Prof. Dr. Falk Schreiber

:: SCREENSHOTS

:: REQUIREMENTS

  • Windows / Linux/  MacOSX
  • Java

:: DOWNLOAD

 VANTED

:: MORE INFORMATION

Citation

Klukas and Schreiber (2010)
Integration of -omics data and networks for biomedical research with VANTED.
Journal of Integrative Biology, 7(2)

Björn H. Junker, Christian Klukas and Falk Schreiber (2006)
VANTED: A system for advanced data analysis and visualization in the context of biological networks.
BMC Bioinformatics, 7:109

SalmoNet – An Integrated multi-layered Network of Salmonella

SalmoNet

:: DESCRIPTION

SalmoNet is an unique resource which combines manual curation, high-throughput data and computational predictions to provide an integrated network for Salmonella at the transcriptional regulatory, metabolic and protein-protein interaction levels.

::DEVELOPER

the Earlham Institute.

:: SCREENSHOTS

N/A

:: REQUIREMENTS

  • Web browser

:: DOWNLOAD

NO

:: MORE INFORMATION

Citation

SalmoNet, an integrated network of ten Salmonella enterica strains reveals common and distinct pathways to host adaptation
Métris A., Sudhakar P., Fazekas D., Demeter A., Ari E., Branchu P, Kingsley R.A., Baranyi J., Korcsmáros T.
NPJ Syst Biol Appl. 2017 Oct 18;3:31. doi: 10.1038/s41540-017-0034-z. eCollection 2017.

GWAB – Web Server for Network-based Boosting of Human Genome-wide Association data

GWAB

:: DESCRIPTION

GWAB (genome-wide Association Boosting) is a web server for the network-based boosting of human GWAS data.

::DEVELOPER

Network Biomedicine Laboratory at Yonsei University, Korea

:: SCREENSHOTS

N/A

:: REQUIREMENTS

  • Web browser

:: DOWNLOAD

 NO

:: MORE INFORMATION

Citation

Nucleic Acids Res. 2017 Jul 3;45(W1):W154-W161. doi: 10.1093/nar/gkx284.
GWAB: a web server for the network-based boosting of human genome-wide association data.
Shim JE, Bang C, Yang S, Lee T, Hwang S, Kim CY, Singh-Blom UM, Marcotte EM, Lee I.

NGSEA – Network-augmented Gene Set Enrichment analysis tool

NGSEA

:: DESCRIPTION

NGSEA (network-based GSEA) measures the enrichment score of functional gene sets using the expression difference of not only individual genes but also their neighbors in the functional network.

::DEVELOPER

Network Biomedicine Laboratory at Yonsei University, Korea

:: SCREENSHOTS

N/A

:: REQUIREMENTS

  • Web browser

:: DOWNLOAD

 NO

:: MORE INFORMATION

Citation

Mol Cells. 2019 Aug 31;42(8):579-588. doi: 10.14348/molcells.2019.0065.
NGSEA: Network-Based Gene Set Enrichment Analysis for Interpreting Gene Expression Phenotypes with Functional Gene Sets.
Han H, Lee S, Lee I

HumanNet v2 – Human Gene Networks for Disease Research

HumanNet v2

:: DESCRIPTION

HumanNet is a human functional gene network by integrating diverse types of omics data using Bayesian statistics framework and demonstrated its ability to retrieve disease genes.

::DEVELOPER

Network Biomedicine Laboratory at Yonsei University, Korea

:: SCREENSHOTS

N/A

:: REQUIREMENTS

  • Web browser

:: DOWNLOAD

 NO

:: MORE INFORMATION

Citation

HumanNet v2: human gene networks for disease research.
Hwang S, Kim CY, Yang S, Kim E, Hart T, Marcotte EM, Lee I.
Nucleic Acids Res. 2019 Jan 8;47(D1):D573-D580. doi: 10.1093/nar/gky1126.

RIDDLE – Network-assisted Gene Set Analysis

RIDDLE

:: DESCRIPTION

RIDDLE (Reflective diffusion and local extension)is a network-based method for characterizing gene sets. It asks if an input query set is significantly “close” to a known pathway or disease set in the human functional network.

::DEVELOPER

Network Biomedicine Laboratory at Yonsei University, Korea and the Marcotte Lab at University of Texas at Austin

:: SCREENSHOTS

N/A

:: REQUIREMENTS

  • Web browser

:: DOWNLOAD

 NO

:: MORE INFORMATION

Citation

Genome Biol. 2012 Dec 26;13(12):R125. doi: 10.1186/gb-2012-13-12-r125.
RIDDLE: reflective diffusion and local extension reveal functional associations for unannotated gene sets via proximity in a gene network.
Wang PI, Hwang S, Kincaid RP, Sullivan CS, Lee I, Marcotte EM.

Exit mobile version