tigre 1.46.0 / tigreBrowser 1.1
:: DESCRIPTION
tigre is an R/Bioconductor package for inference of transcription factor activity and ranking candidate target genes from gene expression time series.
tigreBrowser is a web-based browser for tigre ranking results. It allows easy viewing, sorting and filtering of visualisations of models produced by tigre.
:: DEVELOPER
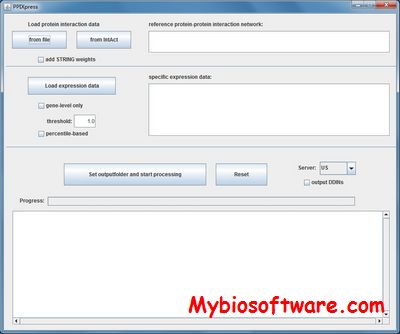
:: SCREENSHOTS
N/A
:: REQUIREMENTS
- Linux / windows/ MacOsX
- BioCOnductor
- R package
- Python
:: DOWNLOAD

:: MORE INFORMATION
Citation
Bioinformatics. 2011 Apr 1;27(7):1026-7. doi: 10.1093/bioinformatics/btr057. Epub 2011 Feb 7.
tigre: Transcription factor inference through gaussian process reconstruction of expression for bioconductor.
Honkela A1, Gao P, Ropponen J, Rattray M, Lawrence ND.