CP ATLAS is a software to analyze TLC and gel images. With CP ATLAS you don’t need a professional densitometer for simple quantitative analysis. You can use a simple digital camera, office scanner or mobile phone to get a picture. With CP ATLAS the analysis takes only a few seconds, and you can copy the results to your spreadsheet software for further usage.
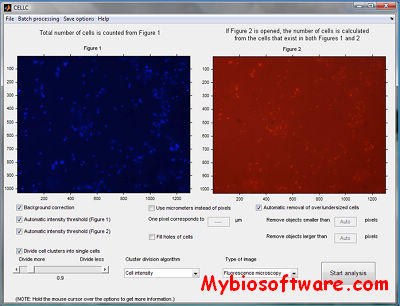
CellC (Cell Counting) was developed and validated for quantification of bacterial cells from digital microscope images. CellC enables automated enumeration of bacterial cells, comparison of total count and specific count images [e.g., 4′,6-diamino-2-phenylindole (DAPI) and fluorescence in situ hybridization (FISH) images], and provides quantitative estimates of cell morphology. The software includes an intuitive graphical user interface that enables easy usage as well as sequential analysis of multiple images without user intervention. Validation of enumeration reveals correlation to be better than 0.98 when total bacterial counts by CellC are compared with manual enumeration, with all validated image types.
Peak Explorer is intended for automatic processing of spectra, and also any plots having strongly expressed local maxima (peaks). The program automatically locates a position of the peak center of gravity (Center), coordinates X and Y of the top point of the peak ((x,y) of Top Point), calculates peak area (Area), standard deviation (sd(Area)) of Area (sd(Area)=) locates left (Left Border) and right (Right Border) boundaries of the peak and draws a linear background under the peak (Background). The Input Data Table and Grapher are situated in the Input Data window.
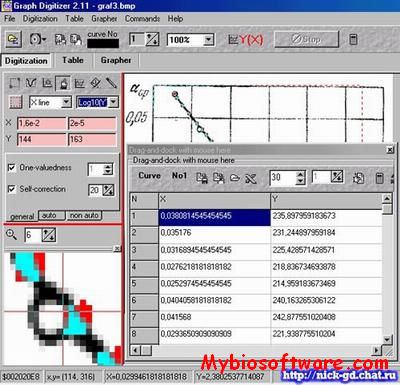
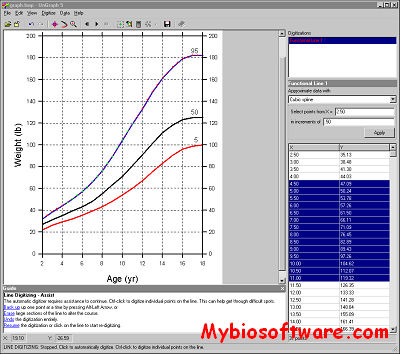
Graph Digitizer intends for digitization of orthogonal graphs (from book, papers). The input graph image file should be in bmp, jpg, tif or gif format. Image of the graph can be scanned or pasted from clipboard. A bad image map can be edited and rotated. A tie to real coordinates of chart implements by allocation of rectangular area and coordinates setting of two points – left-bottom and righ-top corners of this rectangle. There are three modes of digitization. Auto digitization – you define curve color and area of search (the red rectangle) and press button “Auto digitization in rectangle area”. Semi-auto digitization – when you press button “Search in area” and move cursor on (along) a curve. Manual digitization – you press button “Manual input” and click in curve, the value is recorded in the table. Data Y(X) from the Table may be displaed in Grapher or saved in data-file format.
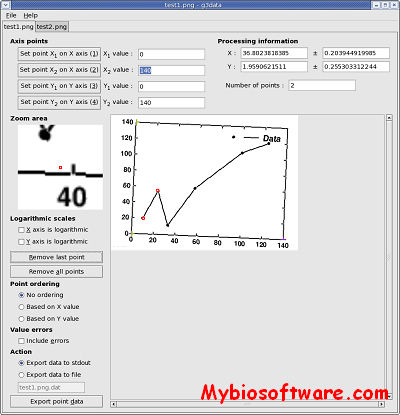
g3data is used for extracting data from graphs. In publications graphs often are included, but the actual data is missing. g3data makes the extracting process much easier.
UnGraph is TWAIN compliant, giving the option to scan images directly from within the software. UnGraph can also directly import images in many formats including TIF, PCX, JPG, BMP and TGA. Images can be panned and zoomed to view and vectorize selected portions. Paint, replace and erase tools allow you to modify images at any time.
QuantiScan for Windows has similar functionality to sophisticated densitometers but at a fraction of the cost. It is able to analyze a wide variety of material including polyacrylamide and agarose gels, autoradiograms, TLC plates, etc. The program will accept images for analysis directly from any TWAIN compliant scanner as well as most BMP, JPG or uncompressed TIF files. For laned gels of reasonable quality, the analysis is highly automated, allowing extremely high throughput of data. Almost any type of image can be analyzed with the manual modes of Quantiscan. Images can be pre-processed in a variety of ways within QuantiScan including crop, flip, invert, scroll and zoom.
Phoretix 1D is the premium 1D Gel analysis product on the market.As well as all of the automated features available in the 1D Gel analysis module of TotalLab Quant it can also perform complex band pattern matching across a gel essential in sample strain analysis, such as cultivar experiments, evolutionary biology and population genetics.
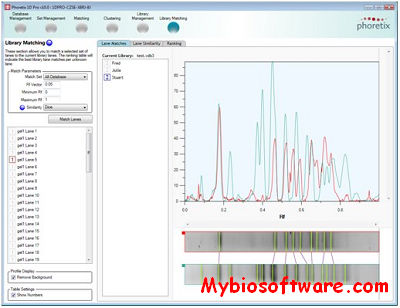
Phoretix 1D Pro allows you to perform large dataset investigations in a fast and easy to use interface. It includes Phoretix 1D analysis software together with a robust database to create a powerful analysis platform.
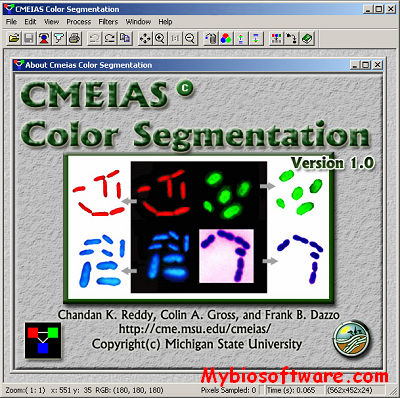
CMEIAS Color Segmentation is a free, improved computing technology designed to alleviate the laborious task of segmenting foreground objects of interest (e.g., microbes) from background in complex digital micrographs, as commonly encountered when preparing digital images of microbial populations and communities in environmental samples for quantitative image analysis.