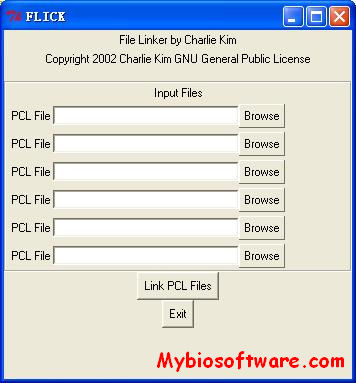
FLICK takes multiple PCL files and creates a single aggregate PCL file.FLICK is written in perl.
Intended for joining datasets which have been created on separate occassions, and which may have different ID values (normally requiring the creation of a database to join the data fields).
CCACK takes an input PCL or CDT (pre- or post-clustering) file and converts all values to a binary scale. CCACK is written in perl. The cutoff is user-defined. Primarily intended for genomotyping analysis. Also see GACK below.
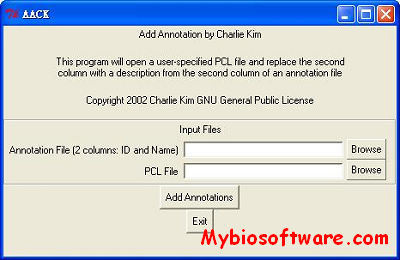
AACK adds annotation from a file to a PCL (pre-clustering) data file. AACK is written in perl.
The annotation file requires an ID and Name column. The ID’s are read from the first column of the PCL file, and the annotations are added to the second column. Does not affect the data. Intended for situations in which a different annotation is desired, such as when an annotation is published for a microarray constructed pre-annotation.
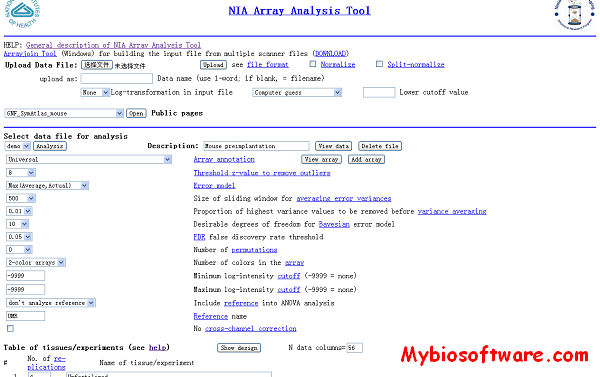
NIA Array Analysis Tool is designed to test statistical significance of gene microarray data, visualize the results, and provide links to clone information and gene index.
Evaluate the statistical significance of differential gene expression based on microarray data
Make log-ratio plots and scatter-plots
Find clusters of tissues with similar expression patterns and identify specific genes for each cluster
Find major patterns of variability in gene expression using Principal Component Analysis (PCA) and biplot
Cluster genes according to their contribution to principal components
Find genes whose expression matches a given pattern (pattern matching)
Plot the dendrogram for replications to check abnormal arrays
Plot the error function (SD vs. expression level)
Make a correlation matrix
Normalize input data
Import principal components from an earlier analysis to overlay 2 sets of results
Save results of analysis for personal or public access
Arrayjoin Tool is designed for compiling an input file from multiple scanner files.
ANOVA Tool – Statistical analysis is based on the single-factor ANalysis Of VAriance
Hierarchical clustering of tissues is done using the average distance method.
Principal component analysis (PCA) is done using the Singular Value Decomposition (SVD) method that generates eigenvectors both for rows and columns of the log-transformed data matrix (Gabriel 1971.
Pattern matching can be used to find genes with expression pattern similar to some other gene (or group of genes).
Gene list analysis – Getting information on selected genes is one of most important components of microarray analysis.
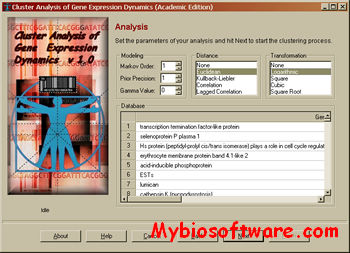
CAGED (Cluster Analysis of Gene Expression Dynamics) is a model based,Bayesian clustering procedure developed by Ramoni et al. to cluster gene expression profiles measured with microarrays in temporal experiments. Contrary to popular clustering methods, CAGED takes into account explicitly the fact that expression profiles in temporal experiments may be serially correlated and uses a model-based, Bayesian procedure to identify the best grouping of the gene expression data in an automated way.
CAGED implements a Bayesian clustering method designed to handle temporal experiments and subsuming standard independent experiments as a special case.
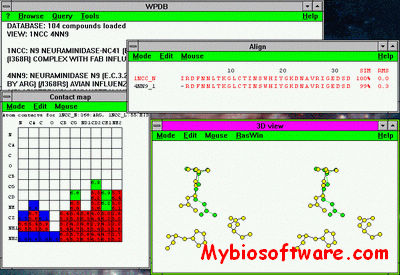
WPDB is a Microsoft Windows based program for browsing and interrogating native and derived structural features of biological macromolecules using data obtained from the Protein Data Bank (PDB). Major features of WPDB are a 20-fold compression of PDB files and query and analysis tools. The latter permit the geometric and sequence properties of structures to be analyzed individually or through comparative analysis. The object oriented software design provides a high level of interaction between display windows which facilitates information discovery.
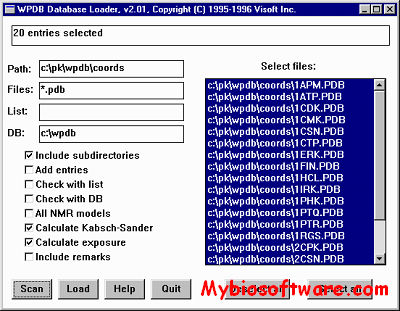
WPDB is useful for detailed analysis of a single structure or comparative analysis of two or more structures. It comes with a variety of databases. Alternatively, you can build your own database from PDB files with the WPDB Loader (WPDBL).
WPDBL Used to build a WPDB database from PDB files for access by the WPDB program. Prebuilt databases of a complete PDB distribution are available already built in the ../ directory.
Those using WPDB should cite:
I.N.Shindyalov and P.E.Bourne J. App. Cryst. 1995, 28(6) 847-852. WPDB A PC-based Tool for Analyzing Protein Structure. [Postscript]
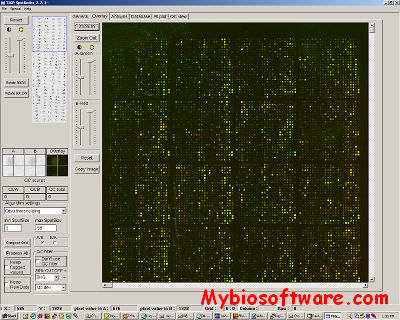
Spotfinder is an image processing program created at The Institute for Genomic Research (J. Craig Venter Institute now) for analysis of the image files generated in microarray expression studies. Spotfinder uses a fast and reproducible algorithm to identify the spots on array and provide quantitation of expression levels.
Image analysis is a crucial step in the microarray process. TIGR Spotfinder was designed for the rapid, reproducible and computer-aided analysis of microarray images and the quantification of gene expression. TIGR Spotfinder reads paired 16-bit or 8-bit TIFF image files generated by most microarray scanners. Semi-automatic grid construction defines the areas of the slide where spots are expected. Automatic and manual grid adjustments help to ensure that each rectangular grid cell is centered on a spot. Two available segmentation methods (histogram and Otsu) define the boundaries between each spot and the surrounding local background. Spot intensities are calculated as an integral of non-saturated pixels, although other options including spot median and mean values are available. Local background subtraction for each reported value is applied by default but can be disabled. The calculated intensities, medians, and means along with each spot position on the array, spot area, background values, and quality control flags are written to a MEV file or the database. Reusable grid geometry files and automatic grid adjustment allow user to analyze large quantities of images in a consistent and efficient manner. To complement the automated methods, particularly in noisy areas of the slide, the user may manually identify or discard spots. Quality control views allow the user to assess systematic biases in the data.
Saeed AI, Sharov V, White J, Li J, Liang W, Bhagabati N, Braisted J, Klapa M, Currier T, Thiagarajan M, Sturn A, Snuffin M, Rezantsev A, Popov D, Ryltsov A, Kostukovich E, Borisovsky I, Liu Z, Vinsavich A, Trush V, Quackenbush J. TM4: a free, open-source system for microarray data management and analysis. Biotechniques. 2003 Feb;34(2):374-8.
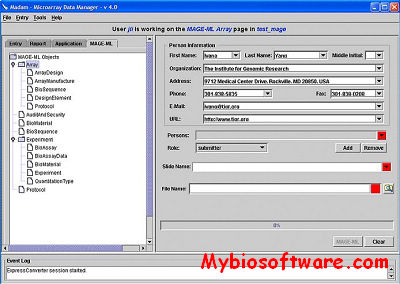
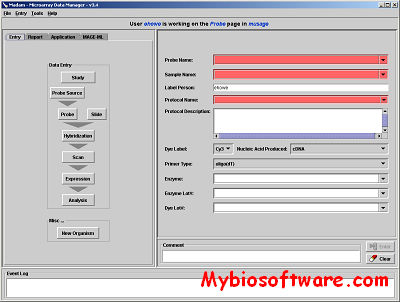
Madam (Microarray Data Manager) is a suite of tools used to upload,download, and display a plethora of microarray data to and from a database management system (MySql). Working as an interface for the MySql, Madam allows scientists and researchers to manage their microarray data efficiently to meet the requirement of experiment annotation and data mining.
Madam implemented in Java, facilitates the entry of data into a relational database. MADAM guides users through the microarray process from RNA procurement to data analysis, offering intelligent forms to simplify the tracking of experimental parameters and results that are essential for the interpretation of expression results in downstream analyses. Canned reports provide information on RNA samples, studies, slide maps and other pertinent data and a general SQL query window allows freeform access to the underlying database.
MADAM also serves as a platform for launching other data entry and management tools. Through the use of these integrated modules, users can view and score PCR plates, design experiments and studies, and track laboratory materials. Although not yet supported, MADAM is being adapted to read and write MAGE-ML, the XML data exchange format being developed by an international consortium of leading public databases and microarray research centers. A MAGE-ML version of MADAM should be available by the end of this year and will facilitate submission of microarray data to public repositories such as Array Express and GEO.
Saeed AI, Sharov V, White J, Li J, Liang W, Bhagabati N, Braisted J, Klapa M, Currier T, Thiagarajan M, Sturn A, Snuffin M, Rezantsev A, Popov D, Ryltsov A, Kostukovich E, Borisovsky I, Liu Z, Vinsavich A, Trush V, Quackenbush J. TM4: a free, open-source system for microarray data management and analysis. Biotechniques. 2003 Feb;34(2):374-8.