rMAPS (rna Map Analysis and Plotting Server) is a web server that systematically generates RNA-maps for the analysis of RNA-binding proteins (RBPs) binding sites which have position-dependent functions.
PLABQTL (PLAnt Breeding QTL analysis)is a program written for the detection of loci which affect the variation of quantitative traits. Its main purpose is to localize and characterize QTL (Quantitative
Trait Loci).
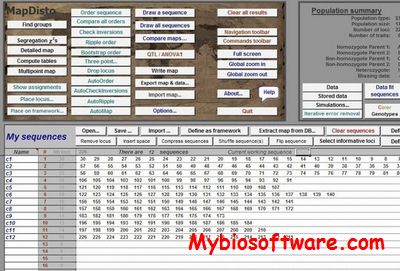
MAPDISTO is a program for mapping genetic markers in experimental segregating populations like backcross, doubled haploids, single-seed descent. Its specificity is to propose recombination fraction estimates in case of segregation distortion. It can (1) compute and draw genetic maps easily and quickly through a graphical interface; (2) facilitate the analysis of marker data showing segregation distortion due to differential viability of gametes or zygotes.
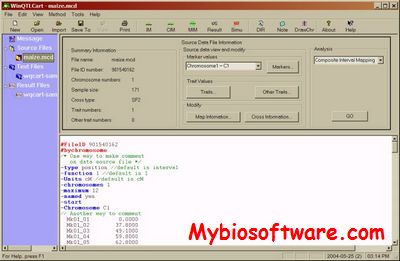
QTL Cartographer 1.17 / Windows QTL Cartographer 2.5.011
:: DESCRIPTION
QTL Cartographer is a suite of programs to map quantitative traits using a map of molecular markers.
Windows QTL Cartographer maps quantitative trait loci in cross populations from inbred lines. It incorporates many of the modules found in its command-line sibling, QTL Cartographer (see above). WinQTLCart includes powerful graphic tools for presenting mapping results and can import and export data in a variety of formats.
RNAmapper uses RNA-seq data to identify both a region of the genome linked to a mutation as well as candidate mutations that may be causal for the phenotype of interest. We have shown that the method can identify mutations that cause nonsense or missense changes to codons, alter transcript splicing, or alter gene expression levels. Here you will find information on how to map your mutations using RNA-Seq data.
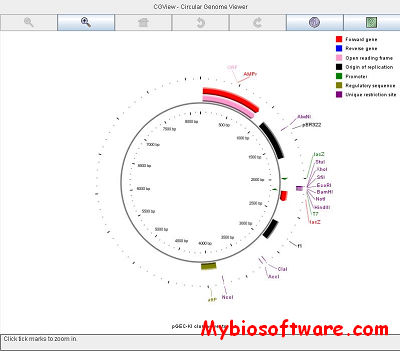
CGView (Circular Genome Viewer) is a Java application and library for generating high-quality, zoomable maps of circular genomes.Its primary purpose is to serve as a component of sequence annotation pipelines, as a means of generating visual output suitable for the web. Feature information and rendering options are supplied to the program using an XML file, a tab delimited file, or an NCBI ptt file. CGView converts the input into a graphical map (PNG, JPG, or Scalable Vector Graphics format), complete with labels, a title, legends, and footnotes. In addition to the default full view map, the program can generate a series of hyperlinked maps showing expanded views. The linked maps can be explored using any web browser, allowing rapid genome browsing, and facilitating data sharing. The feature labels in maps can be hyperlinked to external resources, allowing CGView maps to be integrated with existing web site content or databases.