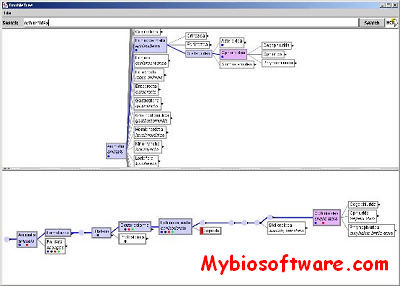
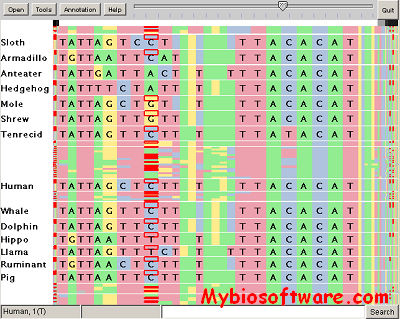
SequenceJuxtaposer is open-source software for browsing and comparing gene sequences, using accordion drawing.It provides an immediate view of a set of sequences that a user can navigatethrough with a few clicks of a mouse.
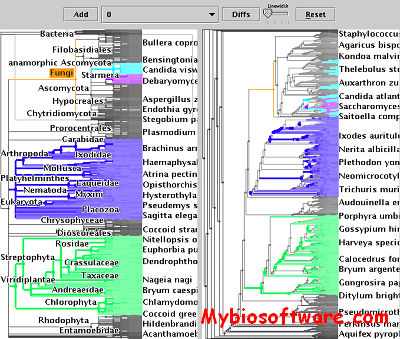
TreeJuxtaposer lets you interactively view a single tree, or compare two or more trees. The software handles all kinds of trees, including phylogenetic trees, taxonomic trees, consensus trees, dendrograms from cluster hierarchies, and others. Uses nested parentheses (Newick/New Hampshire) data format. Guaranteed visibility of marked regions provides visual landmarks. Structural differences are automatically marked, and the marked clades highlight corresponding nodes on the trees through the use of a generalization of the Robinson-Foulds distance metric. Responsive drawing for even very large trees with advanced graphics techniques.
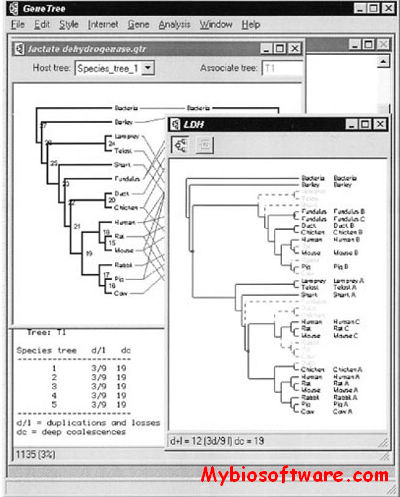
GeneTree is an experimental program for comparing gene and species trees. The program can compute the cost of embedding a gene tree within a species tree, visually display the location and number of gene duplications and losses, and search for optimal species trees.
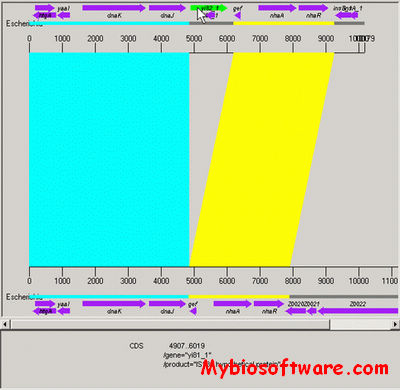
GenomeComp is a tool for summarizing, parsing and visualizing the genome wide sequence comparison results derived from voluminous BLAST textual output, so as to locate the rearrangements, insertions or deletions of genome segments between species or strains.
It can be easily used to compare, parsing and visualize large genomic sequences, especially closely related genomes such as inter-species or inter-strains. In addition, it can also show other sequence features like repeat sequence distributions in one whole-genome DNA sequence by comparing the genome to itself.
CCOMP (Complex COMParison) is a simple command-line tool for comparing ligand/receptor complexes. It can also be used for calculating pairwise all-atom RMSD of slightly different protein structures, taking care of missing atoms, sequence inconsistencies, etc. CCOMP reads two files in PDB format, including both a receptor and a ligand, computes a pairwise sequence alignment of the receptor molecules, generates alpha-carbon superposition of the receptor structures according to the generated alignment, and computes individual deviations per residuum.
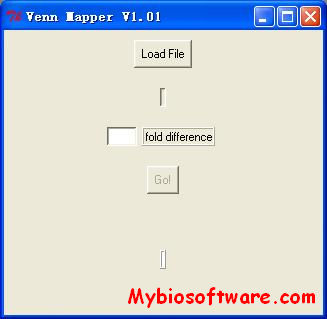
Venn Mapper is a program that cluster heterologous microarray data based on the number of co-occurring differentially expressed genes. The application loads microarray data (gene expression ratios) and determines which genes are up- or down-regulated by a user-defined ratio cut-off level. For each experiment, lists of differentially expressed genes are computed. Every list will be compared to every other list, and the number of co-occurring genes will be calculated. With the use of the binomial distribution, so called z-values can be assigned to the overlap found between two lists. The z-values can be directly imported into the Cluster and/or TreeView software.