TrackSig – Reconstructing Evolutionary Trajectories of Mutations in Cancer

TrackSig

:: DESCRIPTION

TrackSig is a method to estimate the evolutionary trajectories of signatures of somatic mutational processes. TrackSig uses cancer cell fraction (CCF) corrected by copy number to infer an approximate order in which the somatic mutations accumulate. TrackSig segments mutation ordering by CCF and fits signature exposures (activities) as a piece-wise constant function of the mutation ordering. TrackSig uses optimal segmentation to find the points of change in signature activities.

TrackSigFreq is an R package for TrackSig

::DEVELOPER

Morris Lab

:: SCREENSHOTS

N/A

:: REQUIREMENTS

  • Linux
  • R
  • Python

:: DOWNLOAD

TrackSig

:: MORE INFORMATION

Citation

TrackSig: reconstructing evolutionary trajectories of mutations in cancer
Yulia Rubanova, Ruian Shi, Roujia Li, Jeff Wintersinger, Nil Sahin, Amit Deshwar, Quaid Morris, PCAWG Evolution and Heterogeneity Working Group, PCAWG network
doi: https://doi.org/10.1101/260471
PICNIC – Predict Integral Copy Numbers In Cancer

PICNIC

:: DESCRIPTION

PICNIC (Predicting Integral Copy Numbers In Cancer) is an algorithm designed to identify copy number segments and genotypes in cancer using a SNP6 ‘cel’ file as input.

::DEVELOPER

The Sanger Institute

:: SCREENSHOTS

N/A

:: REQUIREMENTS

:: DOWNLOAD

 PICNIC

:: MORE INFORMATION

Citation

Chris D. Greenman et al.
PICNIC: an algorithm to predict absolute allelic copy number variation with microarray cancer data
Biostat (2010) 11 (1): 164-175.

Cancer3D 2.0 – Patterns of Mutations in Cancer

Cancer3D 2.0

:: DESCRIPTION

Cancer3D database provides an open and user-friendly way to analyze cancer missense mutations in the context of structures of proteins they are found in and in relation to patients gender and age.

::DEVELOPER

Godzik Lab

:: SCREENSHOTS

N/A

:: REQUIREMENTS

  • Web browser
:: DOWNLOAD

NO

:: MORE INFORMATION

Citation:

Cancer3D 2.0: interactive analysis of 3D patterns of cancer mutations in cancer subsets.
Sedova M, Iyer M, Li Z, Jaroszewski L, Post KW, Hrabe T, Porta-Pardo E, Godzik A.
Nucleic Acids Res. 2019 Jan 8;47(D1):D895-D899. doi: 10.1093/nar/gky1098.

e-Driver – Identify Protein Regions driving Cancer

e-Driver

:: DESCRIPTION

e-Driver is a method that exploits the internal distribution of somatic missense mutations between the protein’s functional regions (domains or intrinsically disordered regions) to find those that show a bias in their mutation rate as compared with other regions of the same protein, providing evidence of positive selection and suggesting that these proteins may be actual cancer drivers.

::DEVELOPER

Godzik Lab

:: SCREENSHOTS

N/A

:: REQUIREMENTS

  • Linux / Windows/ MacOsX
  • R
  • Perl
:: DOWNLOAD

 e-Driver

:: MORE INFORMATION

Citation:

Bioinformatics. 2014 Jul 26. pii: btu499.
e-Driver: a novel method to identify protein regions driving cancer.
Porta-Pardo E, Godzik A.

ELECANS 1.0.0.2 – Electronic Cancer Simulation Studio

ELECANS 1.0.0.2

:: DESCRIPTION

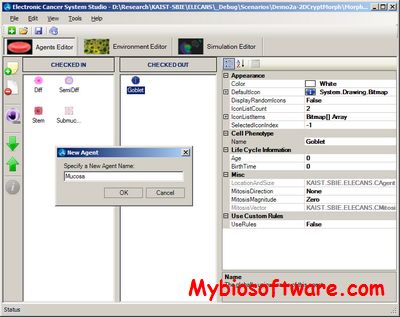
ELECANS is a next generation computational cancer systems biology modeling platform

::DEVELOPER

Laboratory for Systems Biology and Bio-Inspired Engineering [SBIE], KAIST

:: SCREENSHOTS

ELECANS

:: REQUIREMENTS

  • Windows
  • .NET Framework 3.5

:: DOWNLOAD

 ELECANS

:: MORE INFORMATION

Citation

Bioinformatics (2013) 29 (7): 957-959.
ELECANS–an integrated model development environment for multiscale cancer systems biology.
Chaudhary SU, Shin SY, Lee D, Song JH, Cho KH.

CancerMutationAnalysis 3.0 – R Software for Cancer Mutation Analysis

CancerMutationAnalysis 3.0

:: DESCRIPTION

CancerMutationAnalysis is an R package for analyzing somatic mutation data from gancer genp,e sequencing projects.

::DEVELOPER

Giovanni Parmigiani , Simina Maria Boca

:: SCREENSHOTS

N/A

:: REQUIREMENTS

  • Linux/Windows/MacOsX
  • R package

:: DOWNLOAD

  CancerMutationAnalysis

:: MORE INFORMATION

Citation

Parmigiani, Giovanni; Lin, J.; Boca, Simina; Sjoblom, T.; Kinzler, K.W.; Velculescu, V.E.; and Vogelstein, B.,
STATISTICAL METHODS FOR THE ANALYSIS OF CANCER GENOME SEQUENCING DATA” (October 2007).
Johns Hopkins University, Dept. of Biostatistics Working Papers. Working Paper 126.

oncSpectrum 1.0 – Likelihood Analysis of the Spectrum of Somatic Mutations in Cancers

oncSpectrum 1.0

:: DESCRIPTION

oncSpectrum : Likelihood Analysis of the Spectrum of Somatic Mutations in Cancers
::DEVELOPER

Rannala Research Group

:: SCREENSHOTS

N/A

:: REQUIREMENTS

  • Linux/ MacOsX / Windows
  • C Compiler

:: DOWNLOAD

 oncSpectrum

:: MORE INFORMATION

Citation

Z. Yang, S. Ro and B. Rannala. 2003.
Likelihood models of somatic mutation and codon substitution in cancer genes.
Genetics 165: 695-705.

Tool for Biomedical Image Processing & Detection of Cancer using ANN

Biomedical Image Processing & Detection of Cancer

:: DESCRIPTION

 An automatic tool for prediction and classification of cancerous/non-cancerous squamosal cells using image processing and artificial neural networks (ANN). The ANN program is much more flexible and user friendly. It also optimizes number of hidden nodes itself based on the prediction accuracy. The neural network used here is a two layer neural networks and it uses standard back propagation algorithm. The first layer is use for detection of nucleus, cytoplasm and background of the image.Whereas the second layer is used to classify images into cancerous or non-cancerous based on three cellular features: size of nucleus, size of cytoplasm and ratio of nucleus/cytoplasm sizes. Using image processing techniques we extracted 15 features for selected pixel (using a mouse event program written in DOT NET framework) of an image over its 3×3 neighbouring matrix (using program written in MATLAB and C). These parameters are input to first layer of ANN.

::DEVELOPER

Project Team

:: SCREENSHOTS

N/A

:: REQUIREMENTS

  • Windows
  • Matlab

:: DOWNLOAD

 Project

:: MORE INFORMATION

CNAseg 1.0 – Identify CNVs in cancer from NGS data

CNAseg 1.0

:: DESCRIPTION

CNAseg is a novel framework for the identification of CNA events that uses flowcell-to-flowcell variability to estimate the false positive rate and the depth of coverage to finalize copy number calls. HMMseg uses the Skellam distribution to compare read depth in tumour and control samples, which allows the use of smaller window sizes for copy number estimation and leads to greater sensitivity in pinpointing breakpoints for small CNAs.

::DEVELOPER

Sergii Ivakhno

:: SCREENSHOTS

N/A

:: REQUIREMENTS

:: DOWNLOAD

 CNAseg

:: MORE INFORMATION

Citation:

Bioinformatics. 2010 Dec 15;26(24):3051-8. Epub 2010 Oct 21.
CNAseg–a novel framework for identification of copy number changes in cancer from second-generation sequencing data.
Ivakhno S, Royce T, Cox AJ, Evers DJ, Cheetham RK, Tavaré S.

Exit mobile version