GAL File Generator . Conversion of a file of 96 well plates into a file of 384 well plates, and conversion of a file of 384 well plates into an Axon GenePix Gene Array List file (.gal file). Several options are available for this latter function, including spot size, spacing, and orientation of plate in the arrayer with respect to the slides
AMIADA is an integrated computer program for organizing, exploring, visualizing, and analyzing microarray data. It features an EXCEL-like user interface and performs data transformation, principal component analysis, a variety of cluster analysis and extensive graphic functions for visualizing expression profiles.
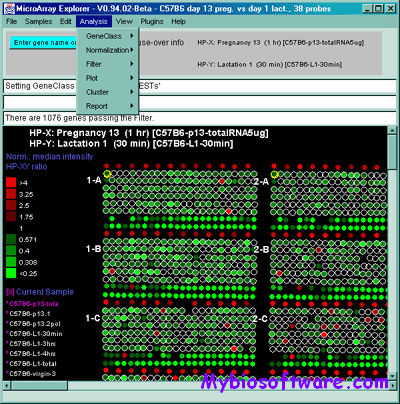
The MAExplorer is a Java-based bioinformatics exploratory data-analysis and data-mining program for analyzing sets of quantitative spotted cDNA or oligonucleotide microarray data . It includes data management, graphics, statistics, clustering, reports, gene data-filtering, user written MAEPlugins, documentation, tutorials, demo data. The exploratory data analysis environment provides tools for the data-mining of quantitative expression profiles across multiple microarrays.
With MAExplorer, it is possible to: 1) analyze the expression of individual genes; 2) analyze the expression of gene families and clusters; 3) compare expression patterns and outliers; 4) directly access other genomic databases for genes of interest. Previously quantified array data is copied to your local computer where it is read by MAExplorer and intermediate results as well as the data mining session state may be saved between data mining sessions.
::DEVELOPER
Dr. Peter Lemkin (LECB/NCI-Frederick) with help from Gregory Thornwall (SAIC) and Jai Evans (DECA/CIT, NIH)
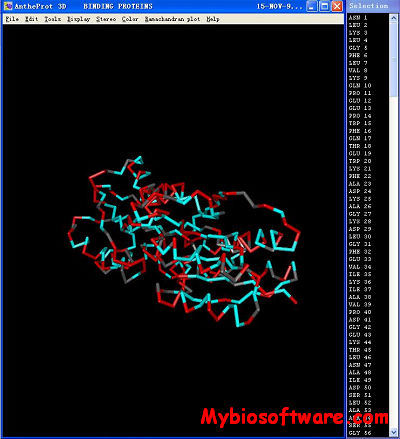
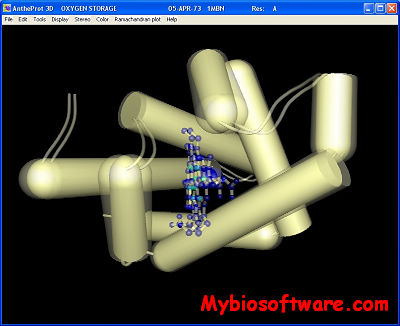
Antheprot 3D is a molecular graphics program intended for the visualisation of proteins, nucleic acids from RCSB archive. The program is aimed at display, teaching and generation of publication quality images.
The program reads in a molecule coordinate file (PDB format) and interactively displays the molecule on the screen in a variety of color schemes and molecule representations. Currently available representations include wireframes, sticks, spheres, ball and stick, atom labels and distances. PDB files that are available either locally (Ctrl+O or File=>Open) or distantly at “POLE Bioinformatique Lyonnais” (Ctrl+I) or File=> PBIL URL can be loaded directly into AntheProt3D.
The program is made of 3 different windows:
A 3D view window which allows the user to interactively move the molecule
A group selection panel for group selection
A text window for provinding the user the list of clicked atoms, information (F2) and PHI, PSI values
A Ramachandran interactive plot is also available
Features
Alpha trace, wireframe, space filled,Balla nd Sticks, Sticks and surface mode.
Full support of clipping (“molecule slicing”)
Full support of stereo (side by side, anaglyph or quad buffer stereo)
Interactive Ramachandran plot
Hydrogen addition or removal by reduce
Selection of amino acids by group, chain or within a sphere
Surface viewer for MSMS files (Sanner, M.F., Spehner, J.-C., and Olson, A.J. (1996).Biopolymers, 38 (3), 305-320.
Ribbon or cylinder mode from Molscript program (P. J. Kraulis, (1991) Journal of Applied Crystallography 24, pp 946-950.)
Support for Delphi electrostatic potential Rocchia, W.; Alexov, E.; Honig, B. (2001) J Phys. Chem. 105, 6507-6514
If you use ANTHEPROT on PC, please cite one of the following references :
Deleage G, Combet C, Blanchet C, Geourjon, C
ANTHEPROT: An integrated protein sequence analysis software with client/server capabilities?
(2001) COMPUTERS IN BIOLOGY AND MEDICINE 31 (4): 259-267
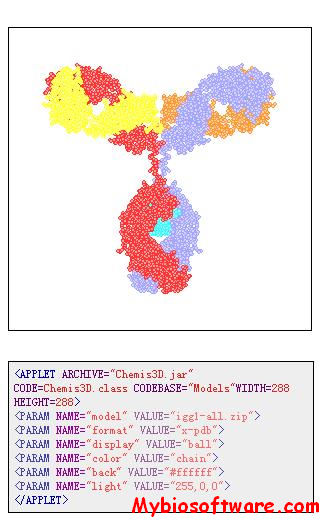
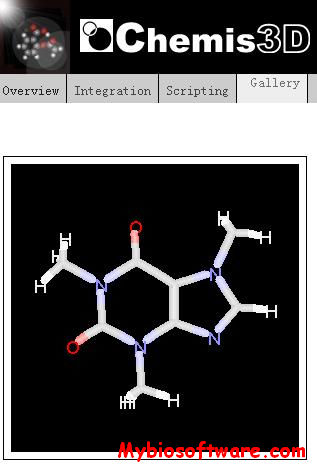
Chemis3D is a Java Applet which renders virtual 3D molecular models within a Web document. It is specially designed for open interactive molecular visualization on the Internet or via an intranet. Molecular structures can be manipulated in real-time and rendered in various styles and appearances.
Chemis3D is a small applet running well on any Java-enabled browser and requiring no specialized plug-in nor professional applications.
Features
Real-time manipulation and fast 3D rendering.
Wide variety of molecular representations including special styles and color coding schemes for proteins and nucleic acids .
Enhanced interface using popumenu and key shortcuts .
Multi-models display and molecular animation capabilities.
Measuring and analysing tools.
Support of the most popular molecular data formats :Brookhaven Protein DataBank (*.pdb).MSC XMol files (*.xyz).MDL molfiles (*.mol).
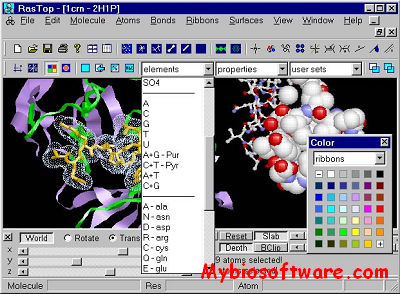
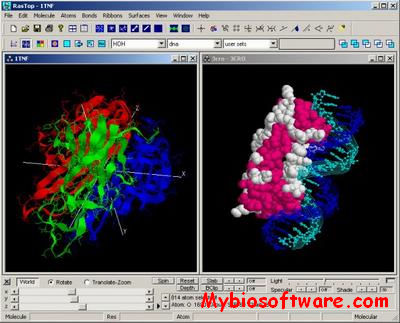
RasTop is a molecular visualization software adapted from the program RasMol, which was initially developed by Roger Sayle. RasTop is particularly adapted for educational purposes and for the rapid analysis of macromolecules at the bench. RasTop wraps a user-friendly graphical interface around the “RasMol molecular engine”. There is no need to type on the command line; each command in the menu generates its own script. Through an extended menu and a command panel, users can manipulate numerous molecules rapidly and learn about them. Work sessions are saved in script format and are fully regenerated with a simple mouse click.
RasTop 2.2 is distributed both under the GPL license ad the Rasmol license. Certain conditions apply to users and to developers to ensure that RasTop remain open source. Please, consult the license.txt and raslic.txt file in the package.
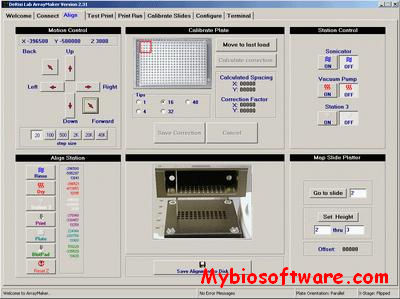
ArrayMaker provides high performance robotic control of microarrayer robots with an incredibly intuitive, easy to use interface. ArrayMaker is optimized for use with the new generation of ultra fast linear servo driven arrayers, yet it is backwards compatible with the original MGuide style of ball-screw driven arrayers.
Features highly flexible configuration options, orange packing, replicate spots, replicate arrays, multiple slide and plate orientations.
This version has a new parameter in the “motor.cfg” file for a separate acceleration value for the x-stage during test prints. This value should be entered on the 19th line of your “motor.cfg” file, inserted between the “HPrintZ” line and the “SpeedX” line.
SilVA (Latin for “forest”) is a tool for the automated harmfulness prediction of synonymous (silent) mutations within the human genome. SilVA bases its predictions on a number of features, including conservation, codon usage, splice sites, splicing enhancers and suppressors, and mRNA folding free energy. Given variants in a VCF file, SilVA will rank the rare synonymous variants according to their predicted harmfulness.
The program sampletrees is a Markov chain Monte Carlo sampler of gene genealogies conditional on either phased or unphased SNP genotype data. The companion program Rsampletrees is for pre- and post-processing of sampletrees files, including setting up the files for sampletrees and storing and plotting the output of a sampletrees run.