Igloo-Plot / Web-igloo
:: DESCRIPTION
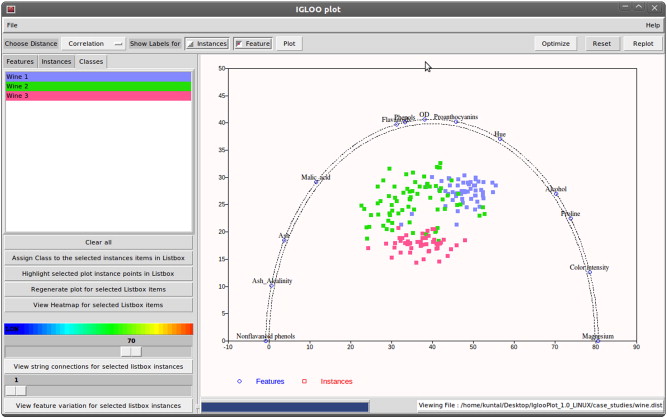
Igloo-Plot is a tool for efficient visualization of multidimensional datasets.
Advertisement
Web-Igloo visualizes multivariate data in a 2D chart of multiple quantitative variables represented as anchors on a semicircle.
::DEVELOPER
:: SCREENSHOTS

:: REQUIREMENTS
- WIndows / Linux
:: DOWNLOAD

:: MORE INFORMATION
Citation
Kuntal BK, Ghosh TS, Mande SS.
Igloo-Plot: a tool for visualization of multidimensional datasets.
Genomics. 2014 Jan;103(1):11-20. doi: 10.1016/j.ygeno.2014.01.004. Epub 2014 Jan 17. PMID: 24444495.
Kuntal BK, Mande SS.
Web-igloo: a web based platform for multivariate data visualization.
Bioinformatics. 2017 Feb 15;33(4):615-617. doi: 10.1093/bioinformatics/btw669. PMID: 27797774.