TreeBuilder3D 1.0
:: DESCRIPTION
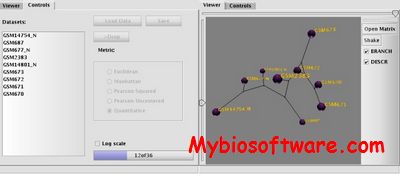
TreeBuilder3D is an interactive viewer that allows organization of SAGE and other types of gene expression data such as microarrays into hierarchical dendrograms, or phenetic networks (the term ‘phenetic’ used as the analysis relies on principals, used in phylogenetic analysis by system biology). Might be used as a visual aid when analyzing differences in expression profiles of SAGE libraries, serves as an alternative to Venn diagrams.
::DEVELOPER
Canada’s Michael Smith Genome Sciences Centre
:: SCREENSHOTS
:: REQUIREMENTS
:: DOWNLOAD
:: MORE INFORMATION
Citation
Ruzanov P, Jones SJ.
An interactive tool for visualization of relationships between gene expression profiles.
BMC Bioinformatics. 2006 Apr 6;7:193.

