AStalavista (the Alternative Splicing Trascriptional Landscape Visualization Tool) retrieves all alternative splicing events from generic transcript annotations.
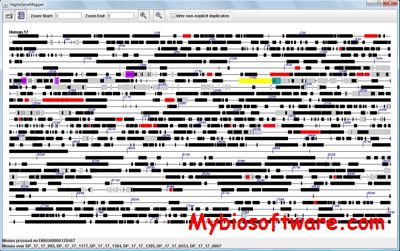
HaploGeneMapper is a tool to visualise the genomic proximity of haploinsufficient genes to segmental duplications on a chromosome-by-chromosome basis. Corresponding pairs of segmental duplications, which may be subject to non-allelic homologous recombination, can be highlighted using the cursor. Similarly, the names of haploinsufficient genes and segmental duplications can be displayed by hovering the cursor over them.
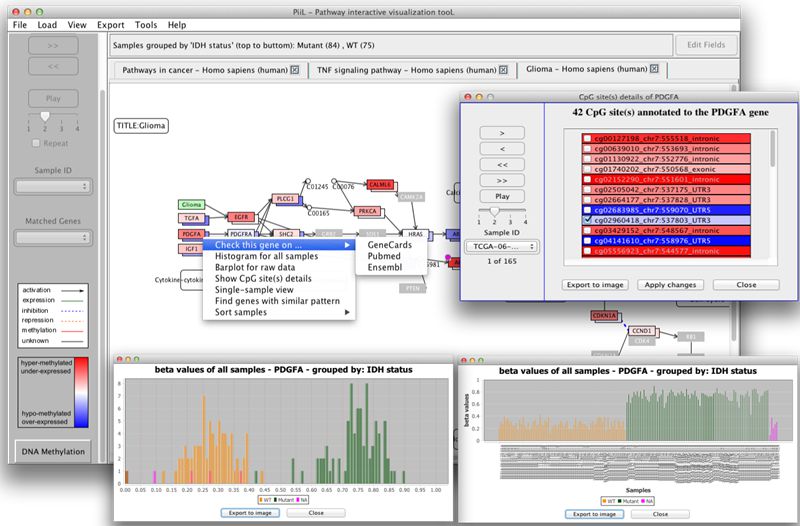
PiiL is an open-source and biologist-friendly tool. You can easily PiiL your data; i.e. load your DNA methylation and/or gene expression data over any of the KEGG pathways and let PiiL color it for you, in order to identify or discover genes with differential methylation / expression patterns. DNA methylation data can be from Illumina’s methylation arrays or RRBS. PiiL provides a set of analytical features facilitating quick assessment of specific patterns, and selecting subsets of CpG sites and examine their impact on expression of the host gene.
Strainer is a multi-platform visualization tool for metagenomics data. It allows the user to easily browse the variation present in shotgun sequence data from non-clonal samples.
DROMPA (DRaw and Observe Multiple enrichment Profiles and Annotation) is cost-effient program for peak-calling and visualization for ChIP-seq analysis. DROMPA outputs the protein binding profile map (ChIP-reads distribution and ChIP/control enrichment profile) with genomic annotation specified in pdf or png format, which can be easily handled and processed by users with little bioinformatics background. DROMPA has an associated program named parse2wig, which preprocesses the map file into wig files. This two-step procedure can drastically reduce the computational memory and time required, which makes enable to analyze large-scale ChIP-seq data (e.g., more than 10 human samples and/or multiple executions for each sample with trial-and-error) on a conventional desktop computer.
DROMPAplus is an update of DROMPA3. It is written in C++ and runs from a single launch command on conventional Linux systems.
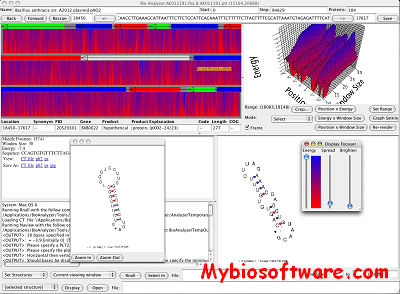
RnallViewer is an RNA analysis and visualization tool that combines information and processing from various command-line tools in an intuitive graphical user interface (GUI). Rnall is used for generating RNA structure predictions, which can be automatically sent to Naview, plt22ps, and Ghostscript for visualization. Annotation information can be included, parsed with the help of BioJava. RnallViewer’s panelling system allows much of this information to be displayed simultaneously, and comprehensive searching methods allow quick access to specific regions based on annotation and position criteria in the format of NCBI ptt format
Wan, X.-F., P. P. Dempsey, and D. Xu. 2008.
RnallViewer: A tool for RNA local secondary structure prediction, localization, and visualization.
International Journal of Computational Science, Special Issue on Bioinformatics and Computational Biology, 2(5): 607-612.
Circleator is a Perl application that generates circular figures of genome-associated data. It leverages BioPerl to support standard annotation and sequence file formats and produces publication-quality SVG output.
::DEVELOPER
Jonathan Crabtree <jonathancrabtree@gmail.com> @ the Institute for Genome Sciences in the University of Maryland’s School of Medicine.
Spark is a discovery tool intended to help you explore the patterns in your genome-wide data. While genome browsers offer a powerful means to integrate diverse data types, their view is inherently limited to individual genomic loci and it can be difficult to obtain a global overview of the predominant data patterns. To address this need, we developed Spark, which enables interactive data clustering and visualization, and serves as a complement to genome browsing.
Cydney B. Nielsen, Hamid Younesy, Henriette O’Geen, Xiaoqin Xu, Andrew R. Jackson, Aleksandar Milosavljevic, Ting Wang, Joseph F. Costello, Martin Hirst, Peggy J. Farnham, Steven J.M. Jones. Spark: A navigational paradigm for genomic data exploration. Genome Research. 2012 Nov;22(11):2262-9.
ABySS-Explorer is an interactive Java application that employs a novel graph-based representation to display a sequence assembly and associated meta data. The tool was designed with the ABySS sequence assembler in mind and was motivated by the need to examine assembly structure, in particular contig connectivity and supporting paired-end read relationships.