SeqExpress 1.3.2 – Analysis and Desktop Visualisation program for Gene Expression Experiments

SeqExpress 1.3.2

:: DESCRIPTION

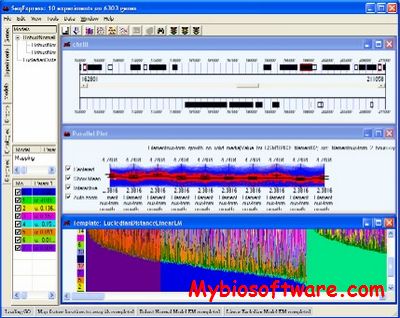
SeqExpress is a comprehensive analysis and visualisation package for gene expression experiments. GO is used to assign functional enrichment scores to clusters, using a combination of specially developed techniques and general statistical methods. These results can be explored using the in built ontology browsing tool or through the generated web pages. SeqExpress also supports numerous data transformation, projection, visualisation, file export/import, searching, integration (with R), and clustering options.

::DEVELOPER

John Boyle

:: SCREENSHOTS

:: REQUIREMENTS

  • Linux / Windows

:: DOWNLOAD

 SeqExpress

:: MORE INFORMATION

Citation

SeqExpress: desktop analysis and visualization tool for gene expression experiments.
Boyle J.
Bioinformatics. 2004 Jul 10;20(10):1649-50. Epub 2004 Feb 26.
 

JLIN 1.6.0 – Visualisation of LD Analysis

JLIN 1.6.0

:: DESCRIPTION

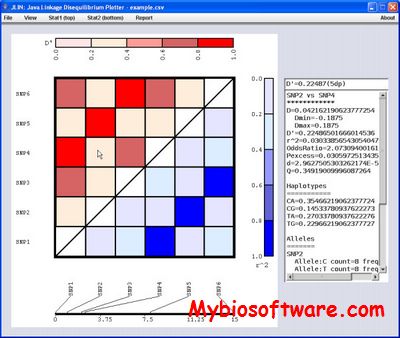
JLIN (Java LINkage disequilibrium plotter) is a software package designed for customisable, intuitive visualisation of Linkage Disequilibrium (LD) across all common computing platforms. Customisation allows the user to choose particular visualisations, statistical measures and measurement ranges. JLIN also allows the user to export images of the LD visualisation in several common document formats.

::DEVELOPER

Centre for Genetic Epidemiology and Biostatistics

:: SCREENSHOTS

:: REQUIREMENTS

  • Windows / Linux / Mac OsX
  • java

:: DOWNLOAD

 JLIN

:: MORE INFORMATION

Citation

Kim W Carter, Pamela A McCaskie and Lyle J Palmer
JLIN: A java based linkage disequilibrium plotter
BMC Bioinformatics 2006, 7:60

Rasmol 2.7.5.2 – Molecular Graphics Visualisation

Rasmol 2.7.5.2

:: DESCRIPTION

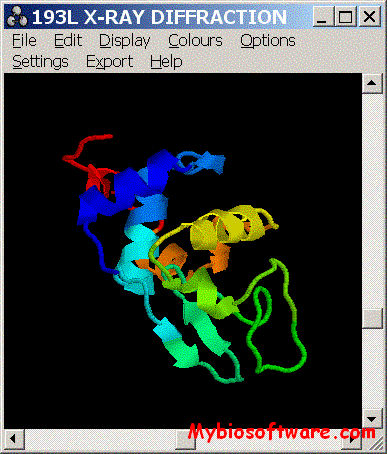
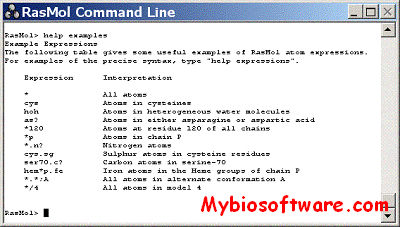
RasMol is a molecular graphics program intended for the visualisation of proteins, nucleic acids and small molecules. The program is aimed at display, teaching and generation of publication quality images.

The program reads in molecular coordinate files and interactively displays the molecule on the screen in a variety of representations and colour schemes. Supported input file formats include Protein Data Bank (PDB), Tripos Associates’ Alchemy and Sybyl Mol2 formats, Molecular Design Limited’s (MDL) Mol file format, Minnesota Supercomputer Center’s (MSC) XYZ (XMol) format, CHARMm format, CIF format and mmCIF format files. It displays the molecule in various representations and allows one to rotate the molecule interactively.

::DEVELOPER

The gforge OpenRasMol project

:: SCREENSHOTS

:: REQUIREMENTS

  • Windows/MacOsX/Linux

:: DOWNLOAD

RasMol

:: MORE INFORMATION

Future releases of RasMol will continue to offer the GPL and RASLIC as alternative licenses for the source code, but, in order to conform to the license conditions of various libraries to which executables may be linked, starting with RasMol 2.7.5 release, the GPL is the only valid license to use the binary distributions.

COSMOS 5.0 / COSMOS Viewer 3.0 – Computer Simulation & Visualisation of Molecular Structures

COSMOS 5.0 / COSMOS Viewer 3.0

:: DESCRIPTION

COSMOS is the advanced software package for PC that integrates modeling, crystallography and NMR spectroscopy.

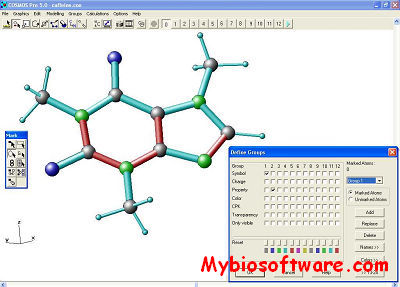
COSMOS Viewer is a freeware product for presentation of molecules. It works with files in COSMOS (*.coo) -format und files in the PDB – Protein Data Bank (*.pdb,*.ent), HYPERCHEM (*.hin), SYBYL (*.mo2), SHELX (*.res, *.ins), GAUSSIAN94,98 (*.out, *.log) and INSIGHT (*.car) format. You can use various styles for graphic representation like stick model, ball-stick model and CPK model, stereo and perspective representation. You can also messure the geometry like distances and angles and perform some calculation tools.

::DEVELOPER

COSMOS Software

:: SCREENSHOTS

:: REQUIREMENTS

  • Windows

:: DOWNLOAD

COSMOSCOSMOS Viewer

:: MORE INFORMATION

N/A