Omix 2.0.5 – Solutions for Systems Biology

Omix 2.0.5

:: DESCRIPTION

Omix is a user-friendly and highly customizable editor and modeling tool for metabolic network diagrams, equipped with extensive data visualization features. Main application fields are the interactive mapping of multi-omics data in the direct context of network drawings, in particular in the fields of transcriptomics, metabolomics and fluxomics.

::DEVELOPER

Omix® Visualization

:: SCREENSHOTS

Omix

:: REQUIREMENTS

  • Windows/Linux/MacOsX
  • Java

:: DOWNLOAD

 Omix

:: MORE INFORMATION

Citation

Visual Workflows for 13C-Metabolic Flux Analysis.
h K, Droste P, Wiechert W.
Bioinformatics. 2014 Oct 7. pii: btu585.

Droste, P., Miebach, S., Niedenführ, S., Wiechert, W., and h, K. 2011.
Visualizing multi-omics data in metabolic networks with the software Omix-A case study.
Biosystems, 105 (2), 154?161.

cMonkey 2 1.2.2 – Biclustering from Diverse System Biology Data

cMonkey 2 1.2.2

:: DESCRIPTION

cMonkey identifies relevant conditions in which the genes within a given bicluster (where “biclustering” is condition- or cell-state-specific clustering) are expected to be co-regulated (importantly, in later stages of analysis we use only these conditions to learn TFs and EFs that influence each bicluster). The methods separates the calculation of the score components associated with each datatype into individual calculations but still effectively sample biclusters that optimally satisfy multiple model components (each representing a separate data-type). The method was designed as a preprocessing step for network inference and performed well in comparison to all other methods tested when the trade-off between sensitivity, specificity, and coverage (fraction of conditions and genes included in one or more biclusters) were considered, particularly in context of the other bulk characteristics (cluster size, residual, etc.).

::DEVELOPER

Baliga Lab

:: SCREENSHOTS

N/A

:: REQUIREMENTS

:: DOWNLOAD

cMonkey

:: MORE INFORMATION

Citation

cMonkey2: Automated, systematic, integrated detection of co-regulated gene modules for any organism.
Reiss DJ, Plaisier CL, Wu WJ, Baliga NS.
Nucleic Acids Res. 2015 Apr 14. pii: gkv300.

BMC Bioinformatics. 2006 Jun 2;7:280.
Integrated biclustering of heterogeneous genome-wide datasets for the inference of global regulatory networks.
Reiss DJ, Baliga NS, Bonneau R.

miRUPnet – A System Biology Approach to Infer the Function of miRNAs

miRUPnet

:: DESCRIPTION

miRUPnet is a tool to predict the function of a miRNA based on functional enrichment analysis of its upstream interacting context.

::DEVELOPER

the Cui Lab

:: SCREENSHOTS

n/a

:: REQUIREMENTS

  • Web browser

:: DOWNLOAD

 NO

:: MORE INFORMATION

Citation

Qiu C, Wang D, Wang E, Cui Q.
An upstream interacting context based framework for the computational inference of microRNA functions.
Mol Biosyst. 2012 Apr;8(5):1492-8. doi: 10.1039/c2mb05469h. Epub 2012 Feb 23. PMID: 22362105.

VANESA 0.3 – Visualization and Analysis of Networks in System Biology

VANESA 0.3

:: DESCRIPTION

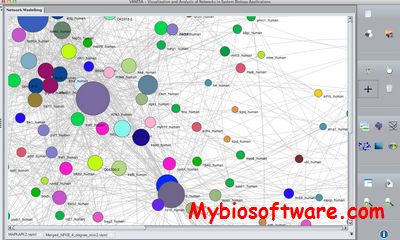
VANESA is a software application for the visualization and analysis of biomedical networks in system biology applications to create systems that can answer fundamental questions and moreover, imitate cell behavior.

::DEVELOPER

the Bioinformatics / Medical Informatics department at Bielefeld University.

:: SCREENSHOTS

VANESA

:: REQUIREMENTS

  •  Linux / Windows/ MacOsX
  • Java

:: DOWNLOAD

 VANESA

:: MORE INFORMATION

Citation

VANESA – a software application for the visualization and analysis of networks in system biology applications.
Brinkrolf C, Janowski SJ, Kormeier B, Lewinski M, Hippe K, Borck D, Hofestädt R.
J Integr Bioinform. 2014 Jun 23;11(2):239. doi: 10.2390/biecoll-jib-2014-239.