EagleEye 1.66 – Remove Background MS/MS Spectra

EagleEye 1.66

:: DESCRIPTION

EagleEye removes background MS/MS spectra by comparing them with a non-annotated collection of spectra, obtained from combined LC-MS/MS runs of control in-gel digests as well as identified in on-going proteomis projects.

::DEVELOPER

SUNYAEV LAB

:: SCREENSHOTS

N/A

:: REQUIREMENTS

  • Web Browser

:: DOWNLOAD

  NO

:: MORE INFORMATION

Citation

Junqueira, M., Spirin, V., Balbuena, T. S., Waridel, P., Surendranath, V., Kryukov, G., Adzhubei, I., Thomas, H., Sunyaev, S. and Shevchenko, A.
Separating the wheat from the chaff: unbiased filtering of background tandem mass spectra improves protein identification.
J Proteome Res. 2008 Aug;7(8):3382-95. Epub 2008 Jun 18.
Fluorescence Spectraviewer 3.1.1 – Plot & Compare Spectra for iPhone/iPad

Fluorescence Spectraviewer 3.1.1

:: DESCRIPTION

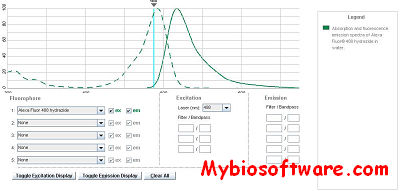
Fluorescence Spectraviewer is a software to plot and compare spectra, check the spectral compatibility for many fluorophores and email the configuration to yourself or others in the lab in a clear printable format.

::DEVELOPER

Thermo Fisher Scientific Inc.

:: SCREENSHOTS

:: REQUIREMENTS

  • iPhone /  iPad / Java

:: DOWNLOAD

Fluorescence Spectraviewer for iPhone

:: MORE INFORMATION

Peakr – Simulating 2D Solid-state NMR Spectra

Peakr

:: DESCRIPTION

Peakr is a software to simulate solid-state NMR spectra of proteins.

::DEVELOPER

Peakr team

:: SCREENSHOTS

N/a

:: REQUIREMENTS

  • Web browser

:: DOWNLOAD

 NO

:: MORE INFORMATION

Citation

Bioinformatics. 2013 May 1;29(9):1134-40. doi: 10.1093/bioinformatics/btt125. Epub 2013 Mar 14.
Peakr: simulating solid-state NMR spectra of proteins.
Schneider R1, Odronitz F, Hammesfahr B, Hellkamp M, Kollmar M.

XGlycScan 20140527 – Quantification of Glycosite Associated Spectra Counts

XGlycScan 20140527

:: DESCRIPTION

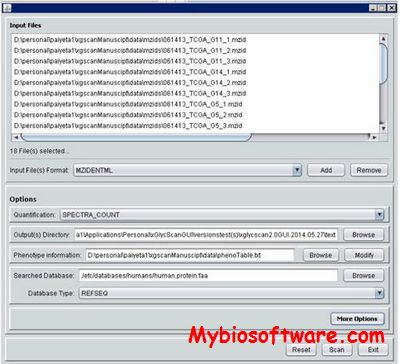
XGlycScan is an open-source software for N-linked glycosite assignment, quantification and quality assessment of data from mass spectrometry-based glycoproteomic analysis.

::DEVELOPER

Paul Aiyetan

:: SCREENSHOTS

XGlycScan

:: REQUIREMENTS

  • Linux / Windows
  • Java

:: DOWNLOAD

 XGlycScan

:: MORE INFORMATION

Citation:

MOJ Proteom Bioinform. 2014;1(1). pii: 00004.
XGlycScan: An Open-source Software For N-linked Glycosite Assignment, Quantification and Quality Assessment of Data from Mass Spectrometry-based Glycoproteomic Analysis.
Aiyetan P1, Zhang B, Zhang Z, Zhang H.

ViQuaS 1.3 – Viral Quasispecies Spectra generated by Next-generation Sequencing

ViQuaS 1.3

:: DESCRIPTION

ViQuaS is based on a novel reference-assisted de novo assembly algorithm for constructing local haplotypes. A significantly extended version of an existing global strain reconstruction algorithm is also used.

::DEVELOPER

Duleepa Jayasundara <d.jayasundara@student.unimelb.edu.au>

:: SCREENSHOTS

N/A

:: REQUIREMENTS

  • Linux
  • R
  • Perl

:: DOWNLOAD

 ViQuaS

:: MORE INFORMATION

Citation:

ViQuaS: An improved reconstruction pipeline for viral quasispecies spectra generated by next-generation sequencing.
Jayasundara D, Saeed I, Maheswararajah S, Chang BC, Tang SL, Halgamuge SK.
Bioinformatics. 2015 Mar 15;31(6):886-96. doi: 10.1093/bioinformatics/btu754

CalSpec 1.3 – Calculate Spectra

CalSpec 1.3

:: DESCRIPTION

CalSpec (Calculate Spectra) is a software module for fast processing of mass spectrometric data in 13C Metabolic Flux Analysis(MFA). Efficient MFA requires a straightforward approach that can be parallelized and automated for all steps involved. A time-consuming and error prone step in the whole procedure of MFA is the extraction of labeling patterns from mass spectrometric spectra. CalSpec for identification of amino acids TBDMS derivates, addresses this problem and provides a software module for automated identification of specified analytes in the MS spectrum, quantification of labeling patterns and estimation of the analyte peak quality.

::DEVELOPER

Max-Planck-Institut Informatik

:: SCREENSHOTS

N/A

:: REQUIREMENTS

  • Windows

:: DOWNLOAD

 CalSpec

:: MORE INFORMATION

Citation

Talwar P, Wittmann C, Lengauer T, & Heinzle E (2003)
Software tool for automated processing of 13C labeling data from mass spectrometric spectra.
Biotechniques 35(6):1214-1215.

Peak Explorer 2.11 – Automatic Processing of Spectra

Peak Explorer 2.11

:: DESCRIPTION

Peak Explorer is intended for automatic processing of spectra, and also any plots having strongly expressed local maxima (peaks). The program automatically locates a position of the peak center of gravity (Center), coordinates X and Y of the top point of the peak ((x,y) of Top Point), calculates peak area (Area), standard deviation (sd(Area)) of Area (sd(Area)=) locates left (Left Border) and right (Right Border) boundaries of the peak and draws a linear background under the peak (Background). The Input Data Table and Grapher are situated in the Input Data window.

::DEVELOPER

KG Software

:: SCREENSHOTS

:: REQUIREMENTS

  • Windows

:: DOWNLOAD

Peak Explorer

:: MORE INFORMATION

Registration