EDIBLE 20110705 – Make Phylogenetic Information Calculations

EDIBLE 20110705

:: DESCRIPTION

EDIBLE (Experimental Design and Information By Likelihood Exploration.) is a software to perform likelihood calculations based on Markov process models of nucleotide substitution allied with phylogenetic trees, and from these to compute Fisher information measures under different experimental designs. These calculations can be used to answer questions of optimal experimental design in molecular phylogenetics.

::DEVELOPER

Goldman Group

:: SCREENSHOTS

N/A

:: REQUIREMENTS

  • Linux / Windows

:: DOWNLOAD

 EDIBLE

:: MORE INFORMATION

Citation:

EDIBLE: experimental design and information calculations in phylogenetics.
Massingham T, Goldman N.
Bioinformatics. 2000 Mar;16(3):294-5.

PhyloRNAalifold v1 – Predicting Consensus Structures in RNA Alignments by incorporating RNAalifold with Phylogenetic information

PhyloRNAalifold v1

:: DESCRIPTION

PhyloRNAalifold is a program for predicting consensus structures of aligned RNA sequences by incorporating phylogetetic-based covarying mutations.

::DEVELOPER

UCF Computational Biology and Bioinformatics Group

:: SCREENSHOTS

N/A

:: REQUIREMENTS

  • Linux
  • C++ Compiler

:: DOWNLOAD

 PhyloRNAalifold

:: MORE INFORMATION

Citation

BMC Bioinformatics. 2013 Apr 27;14:142. doi: 10.1186/1471-2105-14-142.
Incorporating phylogenetic-based covarying mutations into RNAalifold for RNA consensus structure prediction.
Ge P, Zhang S.

Spectrum 2.0 – Show Phylogenetic Information in a Data Set

Spectrum 2.0

:: DESCRIPTION

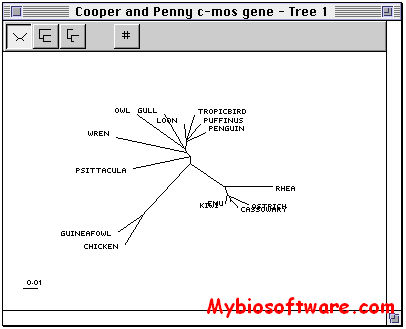
Spectrum is a program designed to read in a data file comprising aligned character arrays (such as DNA sequence data) or distance data in the form of a matrix, and perform some simple spectral analysis procedures on that data.The input file format is NEXUS, as used in PAUP and MacClade.The program reads in phylogenetic 4-state or binary data, or distance data, and outputs the bipartition spectra corresponding to the data. It can also be used it to find the tree whose expected spectrum is closest to your observed spectrum (the “closest tree” and “Manhattan tree”– see the manual). Spectrum outputs spectra in Excel format as tab-delimited text files and trees as TreeView files.

::DEVELOPER

Dr. Michael Charleston

:: SCREENSHOTS

:: REQUIREMENTS

  • Windows / Macintosh

:: DOWNLOAD

Spectrum

:: MORE INFORMATION

Please register your copy of Spectrum! It costs nothing, and if you register I can keep you up to date with bugs, bug fixes, updates etc. E-mail me to register.