NaviCluster 2.0 – Interactive, Multi-Scale Navigation for Large and Complicated Biological Networks

NaviCluster 2.0

:: DESCRIPTION

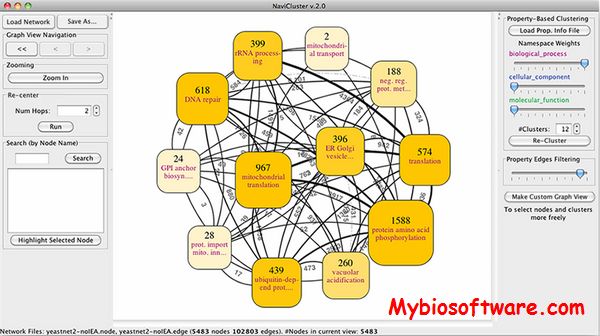
NaviCluster is developed as an interactive, multi-scale navigation tool for large and complicated biological networks.

::DEVELOPER

NaviCluster team

:: SCREENSHOTS

NaviCluster

:: REQUIREMENTS

  • Windows / Linux / MacOsX
  • Java

:: DOWNLOAD

 NaviCluster

:: MORE INFORMATION

Citation

Bioinformatics. 2011 Apr 15;27(8):1121-7. doi: 10.1093/bioinformatics/btr083. Epub 2011 Feb 23.
Interactive, multiscale navigation of large and complicated biological networks.
Praneenararat T1, Takagi T, Iwasaki W.

GenePalette 2.0 – Genome Sequence Visualization and Navigation

GenePalette 2.0

:: DESCRIPTION

GenePalette allows genome sequence visualization and navigation. Users can download from NCBI’s GenBank database large or small segments of genome sequence from a variety of organisms preserving the gene annotation that is associated with that sequence. Sequence elements of interest (transcription factor binding sites, etc. can be searched for and identified in the loaded sequence, and then clearly visualized within a colorful graphical representation of gene organization.

::DEVELOPER

POSAKONY LAB

:: SCREENSHOTS

:: REQUIREMENTS

  • Windows / Linux / MacOSX
  • Java

:: DOWNLOAD

 GenePalette

:: MORE INFORMATION

Citation

Rebeiz M, Posakony JW.
GenePalette: a universal software tool for genome sequence visualization and analysis.
Dev Biol. 2004 Jul 15;271(2):431-438.

GLIEP – Navigation and Exploration of Interconnected Pathway Visualization

GLIEP

:: DESCRIPTION

GLIEP (Glyph-based Link Exploration of Pathways) helps to guide the navigation and exploration process of interconnected pathway visualization as well as providing insight into the overall interconnectivity.

::DEVELOPER

The ISOVIS group

:: SCREENSHOTS

:: REQUIREMENTS

:: DOWNLOAD

 GLIEP

:: MORE INFORMATION

Citation

I. Jusufi, C. Klukas, A. Kerren, and F. Schreiber
Guiding the Interactive Exploration of Metabolic Pathway Interconnections
In Information Visualization, 2011. SAGE Publications