HypoTrace – Image Analysis Software for Measuring Hypocotyl Growth and Shape

HypoTrace

:: DESCRIPTION

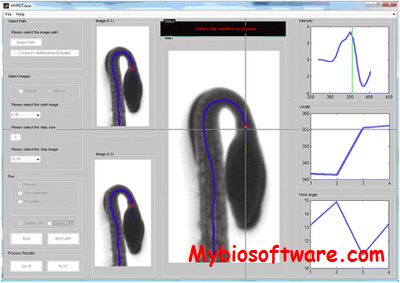
HypoTrace takes time series of image files as input and output growth rate as well as hook angle measurements for Hypocotyls. The software comes with a build-in Graphical User Interface, which allows the software to be run under three modes: 1. Automatic mode with no user intervention, good for high quality images; 2. Semi-Auto mode with a little bit user intervention, good for fair quality images; 3. Manual mode, work for all images including really bad quality images. The three modes are designed to effectively detect the cotyledons bifurcation point under all conditions.

::DEVELOPER

Liya Wang

:: SCREENSHOTS

HypoTrace

:: REQUIREMENTS

  • Windows / Linux / MacOsX
  • Matlab

:: DOWNLOAD

 HypoTrace

:: MORE INFORMATION

Citation

Wang L., Uilecan I. V., Assadi A. H., Kozmik C. A., Spalding E. P.,
HypoTrace: Image Analysis Software for Measuring Hypocotyl Growth and Shape Demonstrated on Arabidopsis Seedlings Undergoing Photomorphogenesis,
Plant Physiol. 2009, 149(4), 1632-1637.

MAIA 2.75 – Microarray Image Analysis

MAIA 2.75

:: DESCRIPTION

MAIA is a software package for automatic processing of the one- and two- (typically, Cy3-green/Cy5-red) color images produced in cDNA, CGH (comparative genome hybridization) or protein microarray technologies. It incorporates the following modules:

  • The spot localization module
  • The spot quantification module
  • The quality control module
  • The image simulator

::DEVELOPER

Institut Curie

:: SCREENSHOTS

:: REQUIREMENTS

:: DOWNLOAD

MAIA

:: MORE INFORMATION

ImageJ 2.2.0 – Image Processing & Analysis in Java

ImageJ 2.2.0

:: DESCRIPTION

ImageJ is a public domain Java image processing program.ImageJ was designed with an open architecture that provides extensibility via Java plugins and recordable macros. Custom acquisition, analysis and processing plugins can be developed using ImageJ’s built-in editor and a Java compiler. User-written plugins make it possible to solve many image processing and analysis problems, from three-dimensional live-cell imaging, to radiological image processing, multiple imaging system data comparisons to automated hematology systems.

::DEVELOPER

ImageJ team

:: SCREENSHOTS

:: REQUIREMENTS

  • Windows / Linux / Mac OsX
  • Java

:: DOWNLOAD

ImageJ

:: MORE INFORMATION

Citation:

Abramoff, M.D., Magelhaes, P.J., Ram, S.J. “Image Processing with ImageJ“.
Biophotonics International, volume 11, issue 7, pp. 36-42, 2004.

CASP 1.2.3beta2 – Image Analysis of Comet Assay

CASP 1.2.3beta2

:: DESCRIPTION

CASP is a tool to image analysis in comet assay. CASP has been developed to work with either color, or gray-scale images of fluorescence-stained comets saved in TIF format. In its present version CASP does not control a video or CCD camera. Comets stained with silver (dark cells on white background) must be converted into negative images in order to be analysed correctly.

::DEVELOPER

Krzysztof Konca

:: SCREENSHOTS

:: REQUIREMENTS

  • Linux/windows

:: DOWNLOAD

 CASP

:: MORE INFORMATION

Citation

Mutat Res. 2003 Jan 10;534(1-2):15-20.
A cross-platform public domain PC image-analysis program for the comet assay.
Końca K, Lankoff A, Banasik A, Lisowska H, Kuszewski T, Góźdź S, Koza Z, Wojcik A.

CellProfiler 4.2.1 – Cell Image Analysis Software

CellProfiler 4.2.1

:: DESCRIPTION

CellProfiler is a cell image analysis software which quantitatively measures phenotypes from thousands of images automatically, usually for high-throughput image-based cell screening experiments.CellProfiler is free open-source software designed to enable biologists without training in computer vision or programming to quantitatively measure phenotypes from thousands of images automatically.

::DEVELOPER

CellProfiler Team

:: SCREENSHOTS

:: REQUIREMENTS

  • Linux / Mac OsX / Windows
  • Java

:: DOWNLOAD

CellProfiler

:: MORE INFORMATION

Citation:

Carpenter AE, Jones TR, Lamprecht MR, Clarke C, Kang IH, Friman O, Guertin DA, Chang JH, Lindquist RA, Moffat J, Golland P, Sabatini DM (2006)
CellProfiler: image analysis software for identifying and quantifying cell phenotypes.
Genome Biology 7:R100. PMID: 17076895

Jones TR, Kang IH, Wheeler DB, Lindquist RA, Papallo A, Sabatini DM, Golland P, Carpenter AE (2008)
CellProfiler Analyst: data exploration and analysis software for complex image-based screens.
BMC Bioinformatics 9(1):482/doi: 10.1186/1471-2105-9-482. PMID: 19014601 PMCID: PMC2614436

Endrov 2.23.3 – Multi-purpose Image Analysis program

Endrov 2.23.3

:: DESCRIPTION

Endrov is a multi-purpose image analysis program. It is written indepedently and designed to address many of the shortcomings of ImageJ and many commercial packages. The sofware is a framework for image analysis and data analysis, aimed towards microscopy and the needs of current research.

::DEVELOPER

HenLab

:: SCREENSHOTS

Endrov

:: REQUIREMENTS

  • MacOsX / Linux / Windows

:: DOWNLOAD

 Endrov

:: MORE INFORMATION

Citation

Nat Methods. 2013 Jun;10(6):454-6. doi: 10.1038/nmeth.2478.
Endrov: an integrated platform for image analysis.
Henriksson J, Hench J, Tong YG, Johansson A, Johansson D, Bürglin TR.

TMAJ 3.7.1 – Tissue MicroArrays Information & Image Analysis Software

TMAJ 3.7.1

:: DESCRIPTION

TMAJ is software for Tissue MicroArrays (TMA’s). Patients, specimens, blocks, slides, cores, images, and scores can all be stored and viewed. Features include advanced security, custom dynamic fields, and an image analysis program.

::DEVELOPER

JHU Tissue MicroArray Core Facility and Vision Multimedia Technologies (VMT).

:: SCREENSHOTS

:: REQUIREMENTS

  • Linux / Mac OsX / Windows
  • Java

:: DOWNLOAD

TMAJ

:: MORE INFORMATION

TiQuant 2 – Biological Tissues Image Analysis and Quantification

TiQuant 2

:: DESCRIPTION

TiQuant is a modular software tool for efficient quantification of biological tissues based on volume data obtained by biomedical image modalities. It includes a number of versatile image and volume processing chains tailored to the analysis of different tissue types which have been experimentally verified. TiQuant implements a novel method for the reconstruction of three-dimensional surfaces of biological systems, data that often cannot be obtained experimentally but which is of utmost importance for tissue modelling in systems biology.

::DEVELOPER

Hoehme Lab • Research group

:: SCREENSHOTS

TiQuant

:: REQUIREMENTS

  •  Linux / WIndows /MacOsX

:: DOWNLOAD

 TiQuant

:: MORE INFORMATION

Citation

TiQuant: Software for tissue analysis, quantification and surface reconstruction.
Friebel A, Neitsch J, Johann T, Hammad S, Hengstler JG, Drasdo D, Hoehme S.
Bioinformatics. 2015 Jun 3. pii: btv346.

ChipSkipper 2.0 – Microarray Image analysis

ChipSkipper 2.0

:: DESCRIPTION

ChipSkipper  combines all  tasks required for analysis and quantitation of micro-array data – both DNA or protein arrays. It’s image processing routines may be also applied to automated evaluation and quantiation of microscopic images.

::DEVELOPER

Christian Schwager, Ph. D.

:: SCREENSHOTS

ChipSkipper

:: REQUIREMENTS

  • Windows

:: DOWNLOAD

 ChipSkipper

:: MORE INFORMATION

MSight 3.0.2 – Image Analysis for LCMS

MSight 3.0.2

:: DESCRIPTION

MSight was specifically developed for the representation of mass spectra along with data from the separation step. The software allows graphical exploration inside huge dataset and gives the scientist access to information that previously was hidden.

::DEVELOPER

Alan Bridge’s group

:: SCREENSHOTS

:: REQUIREMENTS

  • Windows

:: DOWNLOAD

 MSight

:: MORE INFORMATION

Citation

Patricia M. Palagi, Daniel Walther, Manfredo Quadroni, Sébastien Catherinet, Jennifer Burgess, Catherine G. Zimmermann-Ivol, Jean-Charles Sanchez, Pierre-Alain Binz1,, Denis F. Hochstrasser, Ron D. Appel
MSight: An image analysis software for liquid chromatography-mass spectrometry
Proteomics (2005; 5: 2381-2384)