Hollow 1.3 – Illustration software for Proteins

Hollow 1.3

:: DESCRIPTION

HOLLOW facilitates the production of surface images of proteins. Hollow generates fake atoms that identifies voids, pockets, channels and depressions in a protein structure specified in the PDB format.

::DEVELOPER

Hollow team

:: SCREENSHOTS

N/A

:: REQUIREMENTS

  • Windows / Mac /  Linux
  • Python

:: DOWNLOAD

Hollow

:: MORE INFORMATION

Bosco K. Ho and Franz Gruswitz
HOLLOW: Generating Accurate Representations of Channel and Interior Surfaces in Molecular Structures (2008)
BMC Structural Biology 8:49

ORTEP-III 1.03 /for Windows 2021.3 – Crystal Structure Illustration

ORTEP-III 1.03 /for Windows2021.3

:: DESCRIPTION

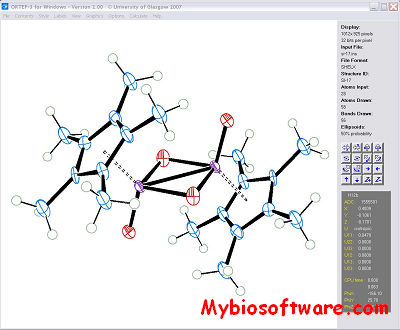
ORTEP-III is Oak Ridge Thermal Ellipsoid Plot Program for crystal structure illustrations.Ball-and-stick type illustrations of a quality suitable for publication are produced with either spheres or thermal-motion probability ellipsoids, derived from anisotropic temperature factor parameters, on the atomic sites. The program also produces stereoscopic pairs of illustrations which aid in the visualization of complex arrangements of atoms and their correlated thermal motion patterns.

Ortep-3 for Windows developed by Dr. Louis Farrugia is a MS-Windows version of the current release of ORTEP-III

::DEVELOPER

Michael N. Burnett and Carroll K. Johnson

:: SCREENSHOTS
:: REQUIREMENTS

  • Windows / Mac /  Linux /
  • POV-Ray

:: DOWNLOAD

ORTEP-III ; Ortep-3 for Windows

:: MORE INFORMATION

Citation:

Michael N. Burnett and Carroll K. Johnson,
ORTEP-III: Oak Ridge Thermal Ellipsoid Plot Program for Crystal Structure Illustrations,
Oak Ridge National Laboratory Report ORNL-6895, 1996.

WinGX and ORTEP for Windows: an update
L. J. Farrugia,
J. Appl. Cryst (2012), 45, 849-854.

PentaPlot 20040723 – Illustration of Genome Mosaicism

PentaPlot 20040723

:: DESCRIPTION

PentaPlot is a software tool that computes the dekapentagonal maps given an appropriate probability support matrix.Dekapentagonal maps depict the phylogenetic relationships of five genomes in a visually appealing diagram and can be viewed as an alternative to a single evolutionary consensus tree.

::DEVELOPER

Gogarten Lab 

:: SCREENSHOTS

N/A

:: REQUIREMENTS

:: DOWNLOAD

 PentaPlot

:: MORE INFORMATION

Citation

HAMEL, L., ZHAXYBAYEVA, O., GOGARTEN J.P. (2005):
PentaPlot: A software tool for the illustration of genome mosaicism.
BMC Bioinformatics 2005,6:139

PovChem 2.1.1 – Chemical Visualization & Illustration & POV File Converter

PovChem 2.1.1

:: DESCRIPTION

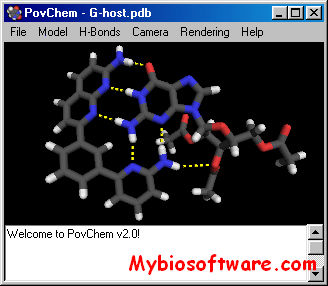
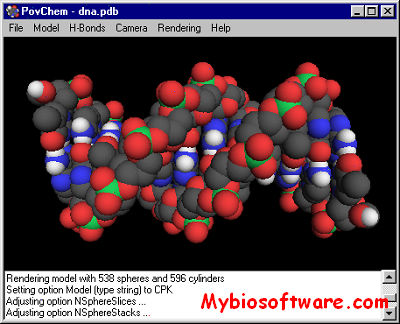
PovChem is a chemical visualization and illustration program with a new graphic interface. It takes molecules in the PDB format, lets you to set up a picture with fine control over details of the illustration – colors, atom and bond radii, view orientation, etc. It will even calculate and display hydrogen bonds.

PovChem can export the picture in POV-Ray format, which allows you to render the image with a state-of-the-art raytracer, giving high-quality images at any resolution, for anything from web page thumbnails to full-size high-resolution images for journal covers, advertisements, posters, anything!

::DEVELOPER

Paul A. Thiessen

:: SCREENSHOTS

:: REQUIREMENTS

:: DOWNLOAD

PovChem

:: MORE INFORMATION

PovChem is now free!Use this key to register your copy of PovChem:
APyUrblJnYZr