Caryoscope 0.4.0 – View Gene Expression Data in Genome

Caryoscope 0.4.0

:: DESCRIPTION

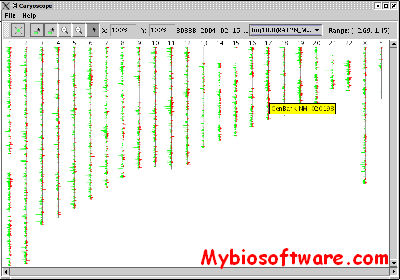
Caryoscope is  an application  for viewing gene expression data in a whole-genome context. Caryoscope has been used to “draw” microarray data onto a set of chromosomes so that changes in DNA copy number can identify regions of chromosome loss or duplication within the genome of tumor cells (Nat Genet. 1999 Sep;23(1):41-6). In addition, microarray data measuring mRNA expression levels can also be visualized in a genomic context using Caryoscope (PNAS 2002 Dec 10;99(25):16144-9). Data viewed with Caryscope need not be limited to microarray data — any type of numerical data that can be represented as a function of genomic position can be visualized using Caryoscope.

::DEVELOPER

Ihab A.B. Awad, Gavin Sherlock etc.

:: SCREENSHOTS

:: REQUIREMENTS

  • Linux / Windows / Max OS X
  • JAVA

:: DOWNLOAD

Caryoscope

:: MORE INFORMATION

Citation:

.Awad, I.A.B, Rees, C.A., Hernandez-Boussard, T., Ball, C.A. and Sherlock, G. (2004)
Caryoscope: An Open Source Java Application for Viewing Microarray Data in a Genomic Context.
BMC Bioinformatics 5:151.
DAGchainer 20080206 – Computing Chains of Syntenic Genes in Complete Genomes

DAGchainer 20080206

:: DESCRIPTION

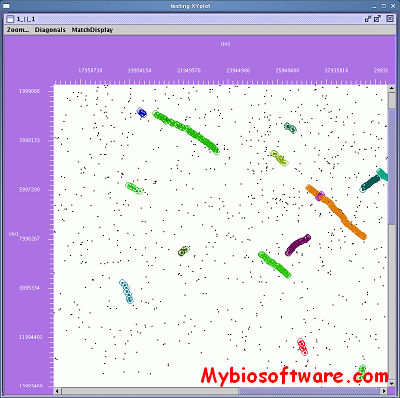
DAGchainer identifies chains of gene pairs sharing conserved order between genomic regions, by identifying paths through a directed acyclic graph (DAG).DAGchainer software computes chains of syntenic genes found within complete genome sequences. As input, DAGchainer accepts a list of gene pairs with sequence homology along with their genome coordinates. Using a scoring function which accounts for the distance between neighboring genes on each DNA molecule and the BLAST E-value score between homologs, maximally scoring chains of ordered gene pairs are computed and reported. This algorithm can be used to mine large evolutionary conserved regions of genomes between two organisms. Alternatively, by examining colinear sets of homologous genes found within a single genome, segmental genome duplications can be revealed.

::DEVELOPER

Brian Haas

:: SCREENSHOTS

:: REQUIREMENTS

:: DOWNLOAD

DAGchainer

:: MORE INFORMATION

Citation:

Haas BJ, Delcher AL, Wortman JR, Salzberg SL.
DAGchainer: a tool for mining segmental genome duplications and synteny.
Bioinformatics. 2004 Dec 12;20(18):3643-6

GRAST 1.0 – Genome Reduction Analysing Software Tool

GRAST 1.0

:: DESCRIPTION

GRAST allows the user to analyse genome reduction by whole genome comparison between a reduced genome and a reference genome (a close relative to the reduced genome). A number of the options in GRAST can also be used for a whole genome comparison of non-reduced genomes.

::DEVELOPER

Dr Mario Fares 

:: SCREENSHOTS

N/A

:: REQUIREMENTS

  • Linux / Windows / MacOsX
  • Perl

:: DOWNLOAD

 GRAST

:: MORE INFORMATION

Citation

GRAST: a new way of genome reduction analysis using comparative genomics.
Toft C, Fares MA.
Bioinformatics. 2006 Jul 1;22(13):1551-61. Epub 2006 Apr 6.

PentaPlot 20040723 – Illustration of Genome Mosaicism

PentaPlot 20040723

:: DESCRIPTION

PentaPlot is a software tool that computes the dekapentagonal maps given an appropriate probability support matrix.Dekapentagonal maps depict the phylogenetic relationships of five genomes in a visually appealing diagram and can be viewed as an alternative to a single evolutionary consensus tree.

::DEVELOPER

Gogarten Lab 

:: SCREENSHOTS

N/A

:: REQUIREMENTS

:: DOWNLOAD

 PentaPlot

:: MORE INFORMATION

Citation

HAMEL, L., ZHAXYBAYEVA, O., GOGARTEN J.P. (2005):
PentaPlot: A software tool for the illustration of genome mosaicism.
BMC Bioinformatics 2005,6:139

GeSICA 1.0.2 – Genome Segmentation from Intra-Chromosomal Associations

GeSICA 1.0.2

:: DESCRIPTION

GeSICA is a two-step strategy of segmenting the human genome into detailed genomic organizational units. In the first step, GeSICA calculates Interaction Ratio of each genomic bin to dichotomize the human genome into two types of states. Only the functional-related regions are taken into account in the second step — Markov Cluster Algorithm (MCL). And a number of clusters are thus generated. Finally, three types of files are generated as the output of GeSICA: the Interaction-Ratio wiggle file, the segmentation bed file and the MCL genomic clusters file.

::DEVELOPER

Zhang Lab

:: SCREENSHOTS

N/A

:: REQUIREMENTS

  • Linux
  • Python

:: DOWNLOAD

 GeSICA

:: MORE INFORMATION

Citation

Liu L, Zhang Y, Feng J, Zheng N, Yin J, Zhang Y.
GeSICA: genome segmentation from intra-chromosomal associations.
BMC Genomics 2012; 13:164.

FastER 1.0 – Identification of Genes with Fast-evolving Regions in closely related Genomes

FastER 1.0

:: DESCRIPTION

FastER is a software for identifying orthologous gene pairs that appear to have fast-evolving regions between two closely related genomes. Its input can be either two closely related whole genome sequences or two closely related orthologous sequences. It consists of two steps: first, it will detect all regions with overrepresented nonsynonymous mutations; second, it will test the nonsynonymous evolution rate against the neutral evolution rate in that gene.

::DEVELOPER

Computational Genomics Laboratory

:: SCREENSHOTS

N/A

:: REQUIREMENTS

:: DOWNLOAD

 FastER

:: MORE INFORMATION

Citation:

Identification of genes with fast-evolving regions in microbial genomes
Yu Zheng, Richard J. Roberts and Simon Kasif
Nucl. Acids Res. (2004) 32 (21): 6347-6357.

ACIB PGDB Toolbox 1.0 – Create, Maintain and Query Pathway/Genome Databases

ACIB PGDB Toolbox 1.0

:: DESCRIPTION

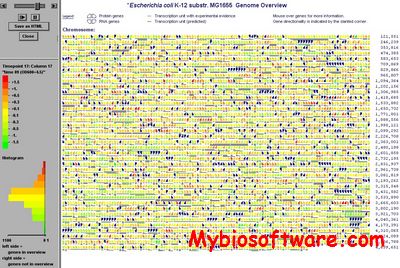
ACIB PGDB Toolbox is a plug-in for Pathway Tools, an integrated systems biology software to create, maintain and query Pathway/Genome Databases. Fully integrated into the graphical user interface (GUI) and menu of Pathway Tools, this plug-in provides functions to create multiple sequence alignments, systematically annotate insertion sequence (IS) elements and analyze their activity by cross-species comparison tools. Microarray probes can be automatically mapped to target genes, and expression data obtained with these arrays can be transformed into input formats needed to visualize them in the various -omics viewers of Pathway Tools

::DEVELOPER

Genomics & Bioinformatics Graz, Graz University of Technology

:: SCREENSHOTS

:: REQUIREMENTS

:: DOWNLOAD

  ACIB PGDB Toolbox

:: MORE INFORMATION

Citation

Krempl PM, Mairhofer J, Striedner G, Thallinger GG.
A Sequence Comparison and Gene Expression Data Integration Add-on for the Pathway Tools Software.
Bioinformatics. 2012 Sep 1;28(17):2283-4.

AAT 20110305 – Analysis & Annotation of Genomic Sequences

AAT 20110305

:: DESCRIPTION

AAT (analysis and annotation tool) includes two sets of programs, one set (DPS/NAP) for comparing the query sequence with a protein database, and the other (DDS/GAP2) for comparing the query with a cDNA database (Huang et al., 1997). Each set contains a fast database search program and a rigorous alignment program. The database search program quickly identifies regions of the query sequence that are similar to a database sequence. Then the alignment program constructs an optimal alignment for each region and the database sequence. The alignment program also reports the coordinates of exons in the query sequence.

::DEVELOPER

Xiaoqiu Huang

:: SCREENSHOTS

N/A

:: REQUIREMENTS

  • Linux

:: DOWNLOAD

AAT

:: MORE INFORMATION

Citation:

Huang, X., Adams, M.D., Zhou, H. and Kerlavage, A.R. (1997).
A tool for analyzing and annotating genomic sequences, Genomics 46, 37-45.

MGRA 1.0 – Multiple Genome Rearrangements and Ancestors

MGRA 1.0.

:: DESCRIPTION

MGRA is a software for reconstruction of phylogenetic trees as well as ancestral genomes and applied it to study the rearrangement history of seven mammalian genomes: human, chimpanzee, macaque, mouse, rat, dog, and opossum. MGRA relies on the new notion of the multiple breakpoint graphs to overcome some limitations of the existing approaches to ancestral genome reconstructions. In particular, we applied \MGRA to analyze the primate–rodent–carnivore controversy in mammalian phylogeny, i.e., the alternative between the primate–rodent and primate–carnivore clades. MGRA provided the rearrangement-based evidence, albeit limited, for the primate–carnivore clade as opposed to the currently favored primate–rodent clade.

::DEVELOPER

Max Alekseyev and Pavel A. Pevzner

:: SCREENSHOTS

N/A

:: REQUIREMENTS

  • Linux
  • C++ Compiler

:: DOWNLOAD

 MGRA

:: MORE INFORMATION

Citation:

Max Alekseyev, Pavel Pevzner
Breakpoint Graphs and Ancestral Genome Reconstructions.”
Genome Res. 2009 May;19(5):943-57. Epub 2009 Feb 13.


DiProGB 20100209 – The Dinucleotide Properties Genome Browser

DiProGB 20100209

:: DESCRIPTION

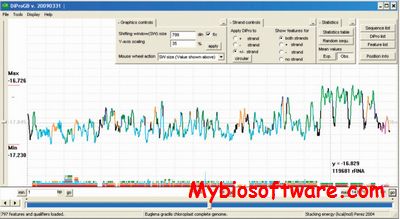
DiProGB is a genome browser that encodes the genome sequence by physico-chemical dinucleotide properties such as stacking energy, melting temperature or twist angle. Analyses can be performed for the + and –, as well as for the double strand.

::DEVELOPER

Dr. Maik Friedel

:: SCREENSHOTS

:: REQUIREMENTS

  • Windows / Linux

:: DOWNLOAD

 DiProGB

:: MORE INFORMATION

Citation

M Friedel, S Nikolajewa, J Suehnel, T Wilhelm.
DiProGB: The Dinucleotide Properties Genome Browser
Bioinformatics 25 (2009) 2603-2604.