mEAT 1.0 – microRNA Enrichment Analysis Tool

mEAT 1.0

:: DESCRIPTION

mEAT is the microRNA Enrichment Analysis Tool

::DEVELOPER

Uwe Ohler’s Research Group

:: SCREENSHOTS

N/A

:: REQUIREMENTS

  • Linux

:: DOWNLOAD

 mEAT

:: MORE INFORMATION

Citation:

Hafner M, Landthaler M, Burger L, Khorshid M, Hausser J, Berninger P, Rothballer A, Ascano M Jr, Jungkamp AC, Munschauer M, Ulrich A, Wardle GS, Dewell S, Zavolan M, Tuschl T.
Transcriptome-wide identification of RNA-binding protein and microRNA target sites by PAR-CLIP.
Cell 2010. 141(1):p129-141

ChEA3 – Gene-list Enrichment Analysis against the manual database

ChEA3

:: DESCRIPTION

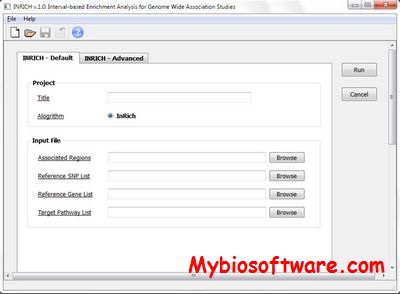
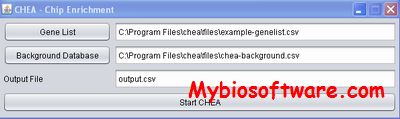
ChEA (ChIP-X Enrichment Analysis) database contains manually extracted datasets of transcription-factor/target-gene interactions from over 100 experiments such as ChIP-chip, ChIP-seq, ChIP-PET applied to mammalian cells. We use the database to analyze mRNA expression data where we perform gene-list enrichment analysis as the prior biological knowledge gene-list library. The system is delivered as web-based interactive software. With this software users can input lists of mammalian genes for which the program computes over-representation of transcription factor targets from the ChEA database.

::DEVELOPER

Ma’ayan Laboratory

:: SCREENSHOTS

ChEA

:: REQUIREMENTS

  • Web browser

:: DOWNLOAD

 ChEA

:: MORE INFORMATION

Citation

ChEA3: transcription factor enrichment analysis by orthogonal omics integration.
Keenan AB, Torre D, Lachmann A, Leong AK, Wojciechowicz ML, Utti V, Jagodnik KM, Kropiwnicki E, Wang Z, Ma’ayan A.
Nucleic Acids Res. 2019 Jul 2;47(W1):W212-W224. doi: 10.1093/nar/gkz446.

ChEA: transcription factor regulation inferred from integrating genome-wide ChIP-X experiments.
Lachmann A, Xu H, Krishnan J, Berger SI, Mazloom AR, Ma’ayan A.
Bioinformatics. 2010 Oct 1;26(19):2438-44.

KEA2 – Kinase Enrichment Analysis

KEA2

:: DESCRIPTION

KEA is a web-based tool with an underlying database providing users with the ability to link lists of mammalian proteins/genes with the kinases that phosphorylate them. The system draws from several available kinase-substrate databases to computes kinase enrichment probability based on the distribution of kinase-substrate proportions in the background kinase-substrate database compared with kinases found to be associated with an input list of genes/proteins.

::DEVELOPER

Ma’ayan Laboratory

:: SCREENSHOTS

KEA

:: REQUIREMENTS

  • Web browser

:: DOWNLOAD

NO

Citation

Bioinformatics. 2009 Mar 1;25(5):684-6. doi: 10.1093/bioinformatics/btp026. Epub 2009 Jan 28.
KEA: kinase enrichment analysis.
Lachmann A, Ma’ayan A.

Network2Canvas – Network Visualization on a Canvas with Enrichment Analysis

Network2Canvas

:: DESCRIPTION

Network2Canvas (N2C) is a web application that provides an alternative way to view networks. N2C visualizes networks by placing nodes on a square toroidal canvas.

::DEVELOPER

Ma’ayan Laboratory

:: SCREENSHOTS

N/A

:: REQUIREMENTS

  • Web Browser

:: DOWNLOAD

 NO

:: MORE INFORMATION

Citation

Bioinformatics. 2013 Aug 1;29(15):1872-8. doi: 10.1093/bioinformatics/btt319. Epub 2013 Jun 7.
Network2Canvas: network visualization on a canvas with enrichment analysis.
Tan CM1, Chen EY, Dannenfelser R, Clark NR, Ma’ayan A.

MotifScan 1.3.0 – Scan input Genomic Regions with known DNA motifs

MotifScan 1.3.0

:: DESCRIPTION

Given a set of input genomic regions, MotifScan scans the sequences to detect the occurrences of known motifs. It can also applies a statistical test on each motif to check whether the motif is significantly over- or under-represented (enriched or depleted) in the input genomic regions compared to another set of control regions.

::DEVELOPER

ShaoLab at CAS-MPG Partner Institute for Computational Biology, SIBS, CAS.

:: SCREENSHOTS

N/A

:: REQUIREMENTS

  • Linux
  • Python

:: DOWNLOAD

 MotifScan

:: MORE INFORMATION

Citation

Sun, H., Wang, J., Gong, Z. et al.
Quantitative integration of epigenomic variation and transcription factor binding using MAmotif toolkit identifies an important role of IRF2 as transcription activator at gene promoters.
Cell Discov 4, 38 (2018).

snpEnrichR – Automating Enrichment analysis of GWAS SNPs

snpEnrichR

:: DESCRIPTION

snpEnrichR is an R package to analyze co-localization of SNPs and their proxies in genomic regions

::DEVELOPER

Computational systems biology group

:: SCREENSHOTS

N/A

:: REQUIREMENTS

  • Linux / Windows / MacOsX
  • R

:: DOWNLOAD

snpEnrichR

:: MORE INFORMATION

Citation

Bioinformatics, 34 (23), 4112-4114 2018 Dec 1
snpEnrichR: Analyzing Co-Localization of SNPs and Their Proxies in Genomic Regions
Kari Nousiainen , et al.

INRICH 1.1 – Interval-based Enrichment Analysis Tool for Genome Wide Association Studies

INRICH 1.1

:: DESCRIPTION

INRICH is a pathway analysis tool for genome wide association studies, designed for detecting enriched association signals of LD-independent genomic regions within biologically relevant gene sets.

::DEVELOPER

Purcell Lab

:: SCREENSHOTS

INRICH

:: REQUIREMENTS

  • Linux/Windows/ MacOsX

:: DOWNLOAD

 INRICH

:: MORE INFORMATION

Citation

INRICH: interval-based enrichment analysis for genome-wide association studies.
Lee PH, O’Dushlaine C, Thomas B, Purcell SM.
Bioinformatics. 2012 Jul 1;28(13):1797-9. doi: 10.1093/bioinformatics/bts191.

GOrilla – Gene Ontology enRIchment anaLysis and visuaLizAtion tool

GOrilla

:: DESCRIPTION

GOrilla is a web-based application that identifies enriched GO terms in ranked lists of genes, without requiring the user to provide explicit target and background sets. This is particularly useful in many typical cases where genomic data may be naturally represented as a ranked list of genes (e.g. by level of expression or of differential expression).

::DEVELOPER

Yakhini Lab

:: SCREENSHOTS

N/A

:: REQUIREMENTS

  • Web Browser

:: DOWNLOAD

 NO

:: MORE INFORMATION

Citation

Eran Eden, Roy Navon, Israel Steinfeld, Doron Lipson and Zohar Yakhini.
GOrilla: A Tool For Discovery And Visualization of Enriched GO Terms in Ranked Gene Lists“,
BMC Bioinformatics 2009, 10:48.

PEIMAN – Enrichment Analysis in Post Translational Modification (PTM) types

PEIMAN 1.0

:: DESCRIPTION

PEIMAN (Post translational modification, Enrichment, Integration and Matching ANalysis ) is a standalone software for enrichment analysis in post translational modification (PTM) types. The software also provides the comparison between two different lists of proteins, focusing on PTM types. Investigating the PTM frequency in each list is also available.

::DEVELOPER

School of Biological Sciences, Iran

:: SCREENSHOTS

N/A

:: REQUIREMENTS

  • Windows/Linux
  • R

:: DOWNLOAD

 PEIMAN

:: MORE INFORMATION

Citation

PEIMAN 1.0: Post-translational modification Enrichment, Integration and Matching ANalysis.
Nickchi P, Jafari M, Kalantari S.
Database (Oxford). 2015 Apr 23;2015. pii: bav037. doi: 10.1093/database/bav037.

MEAGA 1.2 – Minimum distance-based Enrichment Analysis for Genetic Association

MEAGA 1.2

:: DESCRIPTION

MEAGA performs functional/pathway enrichment test while integrating network information from biological interactome (e.g. protein-protein interaction network) using graphical algorithm techniques.

::DEVELOPER

Abecasis Group

:: SCREENSHOTS

N/A

:: REQUIREMENTS

:: DOWNLOAD

 MEAGA

:: MORE INFORMATION

Citation

Graphical algorithm for integration of genetic and biological data: Proof of principle using psoriasis as a model.
Tsoi LC, Elder JT, Abecasis GR.
Bioinformatics. 2014 Dec 4. pii: btu799.