FISH Oracle 2 – Visualize Data from multiple Array CGH or SNP Array Experiments

FISH Oracle 2

:: DESCRIPTION

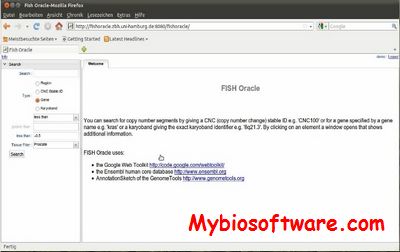
FISH Oracle is a web-based software to visualize data from multiple array CGH or SNP array experiments in a genomic context. Its fast visualization engine and advanced web and database technology supports highly interactive use. FISH Oracle comes with a convenient data import mechanism, powerful search options for genomic elements (like gene names or karyobands), quick navigation and  zooming into interesting regions, and mechanisms to export the visualization into different high quality image formats (PDF, PS, PNG, SVG).

::DEVELOPER

RESEARCH GROUP FOR GENOME INFORMATICS ,Center for Bioinformatics, University of Hamburg

:: SCREENSHOTS

:: REQUIREMENTS

  • Linux / MacOsX
  • MySQL
  • Java
  • Apache Tomcat server
  • GenomeTools

:: DOWNLOAD

  FISH Oracle

:: MORE INFORMATION

Citation

M. Mader, R. Simon, S. Steinbiss and S. Kurtz:
FISH Oracle: a web server for flexible visualization of DNA copy number data in a genomic context.
Journal of Clinical Bioinformatics, 1:20 (2011)
cMonkey 2 1.2.2 – Biclustering from Diverse System Biology Data

cMonkey 2 1.2.2

:: DESCRIPTION

cMonkey identifies relevant conditions in which the genes within a given bicluster (where “biclustering” is condition- or cell-state-specific clustering) are expected to be co-regulated (importantly, in later stages of analysis we use only these conditions to learn TFs and EFs that influence each bicluster). The methods separates the calculation of the score components associated with each datatype into individual calculations but still effectively sample biclusters that optimally satisfy multiple model components (each representing a separate data-type). The method was designed as a preprocessing step for network inference and performed well in comparison to all other methods tested when the trade-off between sensitivity, specificity, and coverage (fraction of conditions and genes included in one or more biclusters) were considered, particularly in context of the other bulk characteristics (cluster size, residual, etc.).

::DEVELOPER

Baliga Lab

:: SCREENSHOTS

N/A

:: REQUIREMENTS

:: DOWNLOAD

cMonkey

:: MORE INFORMATION

Citation

cMonkey2: Automated, systematic, integrated detection of co-regulated gene modules for any organism.
Reiss DJ, Plaisier CL, Wu WJ, Baliga NS.
Nucleic Acids Res. 2015 Apr 14. pii: gkv300.

BMC Bioinformatics. 2006 Jun 2;7:280.
Integrated biclustering of heterogeneous genome-wide datasets for the inference of global regulatory networks.
Reiss DJ, Baliga NS, Bonneau R.

MitoSeek 1.3 – Extract Mitochondrial Genome information from Exome Sequencing data

MitoSeek 1.3

:: DESCRIPTION

MitoSeek is an open-source software tool to reliably and easily extract mitochondrial genome information from exome sequencing data. MitoSeek evaluates mitochondrial genome alignment quality, estimates relative mitochondrial copy numbers, and detects heteroplasmy, somatic mutation, and structural variance of the mitochondrial genome.

::DEVELOPER

Jiang (River) Li

:: SCREENSHOTS

N/A

:: REQUIREMENTS

  • Linux
  • Perl

:: DOWNLOAD

 MitoSeek

:: MORE INFORMATION

Citation

Yan Guo, Jiang Li, Yu Shyr, David C. Samuels.
MitoSeek: Extracting Mitochondria Information and Performing High Throughput Mitochondria Sequencing Analysis.
Bioinformatics (2013) 29 (9): 1210-1211

BLISS 0.7 – Identify Batch Effects in RNA Expression Data

BLISS 0.7

:: DESCRIPTION

BLISS (The Batch anaLysIS Suite) is intended to help identify batch effects in RNA expression data.  It has been tested on miRNA and mRNA results derived from the illumina sequencing platform.

::DEVELOPER

Canada’s Michael Smith Genome Sciences Centre

: SCREENSHOTS

N/A

:: REQUIREMENTS

  • Linux / Windows

:: DOWNLOAD

 BLISS

:: MORE INFORMATION

eRNA 1.01 – RNA Data Analysis Tool

eRNA 1.01

:: DESCRIPTION

eRNA is an RNA data analysis tool for high-throughput RNA sequencing experiments

::DEVELOPER

eRNA team

:: SCREENSHOTS

:: REQUIREMENTS

  • Linux
  • Perl
  • R

:: DOWNLOAD

 eRNA 

:: MORE INFORMATION

Citation:

BMC Genomics. 2014 Mar 5;15:176. doi: 10.1186/1471-2164-15-176.
eRNA: a graphic user interface-based tool optimized for large data analysis from high-throughput RNA sequencing.
Yuan T, Huang X, Dittmar RL, Du M, Kohli M, Boardman L, Thibodeau SN, Wang L

BioAnalyzer 2100 – Analysis of BioAnalyzer data

BioAnalyzer 2100

:: DESCRIPTION

The Agilent 2100 BioAnalyzer is a nanofluidics device that preforms size fractionation and quantification of small samples of DNA, RNA, or Protein. In addition, the BioAnalyzer is able to preform flow cytometry on small numbers of cells.

::DEVELOPER

the MIT BioMicro Center

:: SCREENSHOTS

:: REQUIREMENTS

  • Windows

:: DOWNLOAD

 BioAnalyzer

:: MORE INFORMATION

mseq 1.2 – Modeling non-uniformity in Short-read Rates in RNA-Seq data

mseq 1.2

:: DESCRIPTION

mseq is an R package for modeling non-uniformity in short-read rates in RNA-Seq data.

::DEVELOPER

Jun Li

:: SCREENSHOTS

N/A

:: REQUIREMENTS

  • MacOsX/  Linux / WIndows
  • R Package

:: DOWNLOAD

 mseq

:: MORE INFORMATION

Citation

Jun Li, Hui Jiang, and Wing H Wong (2010)
Modeling non-uniformity in short-read rates in RNA-Seq data.
Genome Biology 11(5): R50.

ChromA 0.9 – Alignment for Chromatography Mass Spectrometry Data

ChromA 0.9

:: DESCRIPTION

ChromA (Chromatogram Alignment) provides the Dynamic Time Warping algorithm for the alignment of data from the domain of Gas- and Liquid-Chromatography Mass-Spectrometry. It uses additional constraints and can be configured to use different local functions to evaluate the similarity of mass spectra between chromatograms. It allows the definition of anchors, which are the positions of conserved compounds, constraining the alignment and providing a speedup. Furthermore, ChromA provides different visualizations of the alignment, as well as a textual format for further processing of chromatograms.

::DEVELOPER

Nils Hoffmann

:: SCREENSHOTS

:: REQUIREMENTS

  • Linux / Mac / Windows
  • Java

:: DOWNLOAD

ChromA

:: MORE INFORMATION

Citation

ChromA: Signal Based Retention Time Alignment for Chromatography-Mass Spectrometry Data
Nils Hoffmann; Jens Stoye
Bioinformatics 2009; doi: 10.1093/bioinformatics/btp343

VRMLGen 1.4.6 – An R Package for 3D Data Visualization on the Web

VRMLGen 1.4.6

:: DESCRIPTION

VRMLGen is a free R software package to generate 3D representations of biological data in the Virtual Reality Markup Language

::DEVELOPER

VRMLGen team

:: SCREENSHOTS

N/A

:: REQUIREMENTS

  • Windows/Linux
  • R

:: DOWNLOAD

VRMLGen

:: MORE INFORMATION

Citation

Enrico Glaab, Jonathan M. Garibaldi, Natalio Krasnogor
vrmlgen: An R Package for 3D Data Visualization on the Web
Journal of Statistical Software, 2010 DOI: 10.18637/jss.v036.i08

apLCMS 6.6.6 – adaptive processing of high resolution LC/MS data

apLCMS 6.6.6

:: DESCRIPTION

apLCMS is an R package which designed for the processing of LC/MS based metabolomics data. It starts with a group of LC/MS files in the same folder, and generates a table with features in the rows and intensities in the columns.

::DEVELOPER

Tianwei Yu

:: SCREENSHOTS

N/A

:: REQUIREMENTS

  • Linux / Windows / MacOsX
  • R

:: DOWNLOAD

apLCMS

:: MORE INFORMATION

Citation

apLCMS–adaptive processing of high-resolution LC/MS data.
Yu T, Park Y, Johnson JM, Jones DP.
Bioinformatics. 2009 Aug 1;25(15):1930-6. doi: 10.1093/bioinformatics/btp291.

Exit mobile version