WH is a computer program that carries out the fitting of a speciation model, and conducts tests of the quality of fit of that model. The speciation model is called the Isolation Model, and is one without gene flow. With comparative DNA sequence data from each of two closely related species, the method allows an estimation of the time since speciation and the size of the ancestral species.
The PhyloMap can generate elegant visualizations for large sequence data sets up to thousands of taxon require only a relatively short computation time. It can give you an overview of your entire data set, and automatically select a small number of sequences which are evenly sampled across your data set. You can build a phylogenetic tree using the sampling sequences and use it as a reference data set for further studies. The PhyloMap also shows you the relationships between the sampled data set with the entire data set.
Quake is a package to correct substitution sequencing errors in experiments with deep coverage (e.g. >15X), specifically intended for Illumina sequencing reads. Quake adopts the k-mer error correction framework, first introduced by the EULER genome assembly package. Unlike EULER and similar progams, Quake utilizes a robust mixture model of erroneous and genuine k-mer distributions to determine where errors are located. Then Quake uses read quality values and learns the nucleotide to nucleotide error rates to determine what types of errors are most likely. This leads to more corrections and greater accuracy, especially with respect to avoiding mis-corrections, which create false sequence unsimilar to anything in the original genome sequence from which the read was taken.
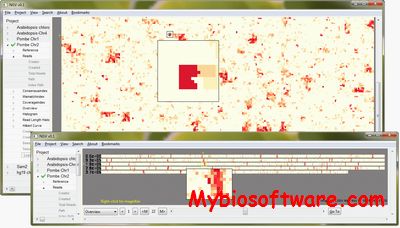
NGV (Next Generation Viewer) is a Preprocessor and Browser for efficient display of large HTS Data Sets. In a preprocessing step, NGV takes a genomic sequence and a file containing mapped reads as input and creates several indices. This preprocessing step is easily extendable by a plug-in mechanism. Preprocessed data sets can then be loaded and visualized efficiently: NGV provides several information visualizations (coverage histogram, coverage overviews, detail view). It makes use of interval tree-based indices to efficiently visualize large HTS data sets and enable users to search for regions with a defined minimum coverage as well as for mismatches between consensus and reference sequence.
MicroMerge automates merging of microsatellite data sets that were genotyped at different facilities or using different protocols or platforms. The software employs a Bayesian statistical model that matches allele frequencies between data sets (Presson et al. 2006). MicroMerge v2.0 enables the following aspects of control: 1) output file formats which can be handled by most statistical genetic analysis packages, 2) tailoring the algorithm to different merging scenarios, such as data sets with very different sample sizes or multiple data sets, 3) merging small data sets when a reliable set of allele frequencies are available, and 4) improving the quantity and 5) quality of merged data.
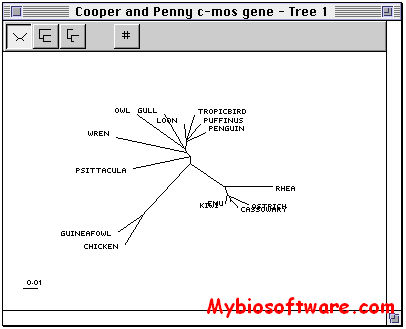
Spectrum is a program designed to read in a data file comprising aligned character arrays (such as DNA sequence data) or distance data in the form of a matrix, and perform some simple spectral analysis procedures on that data.The input file format is NEXUS, as used in PAUP and MacClade.The program reads in phylogenetic 4-state or binary data, or distance data, and outputs the bipartition spectra corresponding to the data. It can also be used it to find the tree whose expected spectrum is closest to your observed spectrum (the “closest tree” and “Manhattan tree”– see the manual). Spectrum outputs spectra in Excel format as tab-delimited text files and trees as TreeView files.
Please register your copy of Spectrum! It costs nothing, and if you register I can keep you up to date with bugs, bug fixes, updates etc. E-mail me to register.