ViSNE / CYT – Map High-dimensional Cytometry data onto Two Dimensions

ViSNE / CYT

:: DESCRIPTION

viSNE is a tool that allows one to map high-dimensional cytometry data onto two dimensions, yet conserve the high-dimensional structure of the data. viSNE plots individual cells in a visual similar to a scatter plot, while using all pairwise distances in high dimension to determine each cell’s location in the plot.

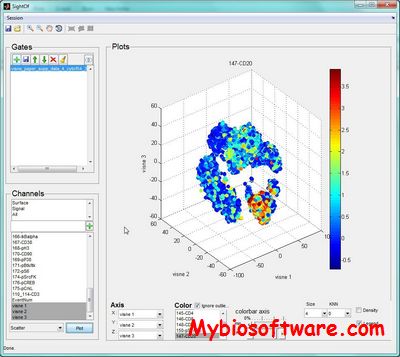
CYT is an interactive visualization tool designed for the analysis of viSNE maps and the high-dimensional mass or flow cytometry data from which these maps were projected.

::DEVELOPER

Dana Pe’er Lab

:: SCREENSHOTS

CYT

:: REQUIREMENTS

  • Windows / Mac /  Linux
  • Matlab
  • Java

:: DOWNLOAD

 ViSNE / CYT

:: MORE INFORMATION

Citation

Nat Biotechnol. 2013 Jun;31(6):545-52. doi: 10.1038/nbt.2594.
viSNE enables visualization of high dimensional single-cell data and reveals phenotypic heterogeneity of leukemia.
Amir el-AD, Davis KL, Tadmor MD, Simonds EF, Levine JH, Bendall SC, Shenfeld DK, Krishnaswamy S, Nolan GP, Pe’er D.

C2G v1.2.2 – Visualize Clustering Results of multi-dimensional Flow/Mass Cytometry data

C2G v1.2.2

:: DESCRIPTION

C2G (Cluster-to-Gate) is a tool developed to generate nested 2D gating hierarchy from clustered flow and mass cytometry data.

::DEVELOPER

Peng Qiu

:: SCREENSHOTS

N/A

:: REQUIREMENTS

  • Windows
  • Matlab

:: DOWNLOAD

C2G

:: MORE INFORMATION

Citation

Yang X, Qiu P.
Automatically generate two-dimensional gating hierarchy from clustered cytometry data.
Cytometry A. 2018 Oct;93(10):1039-1050. doi: 10.1002/cyto.a.23577. Epub 2018 Sep 3. PMID: 30176185.

Cytobank – Analytics Platform for Community Cytometry Data Analysis

Cytobank

:: DESCRIPTION

Cytobank is a platform that allows researchers to annotate, analyze, and share results along with the underlying single-cell data.

::DEVELOPER

Cytobank Inc.

:: SCREENSHOTS

N/A

:: REQUIREMENTS

  • Web Browser

:: DOWNLOAD

 NO

:: MORE INFORMATION

Citation

Curr Top Microbiol Immunol. 2014;377:127-57. doi: 10.1007/82_2014_364.
Cytobank: providing an analytics platform for community cytometry data analysis and collaboration.
Chen TJ1, Kotecha N.

Vcellid 0.4 /CellID 1.4.6 / Rcell 1.1-8 – Microscope-Based Cytometry Cell-finding, Tracking & Analysis

Vcellid 0.4 /CellID 1.4.6 / Rcell 1.1-8

:: DESCRIPTION

Cell-ID is an open-source cell-finding, tracking, and analysis package using microscope based cytometry. Cell-ID have been used  to track cells through time courses of cells containing fluorescent reporters, reporters of fluorescence translocation , and FRET reporters.

Vcellid is a graphic user interface for the Cell-ID software developed by Andrew Gordon. It was originally designed to provide a rapid visual feedback of the effects of different segmentation parameter values, and to ease the analysis of cell-tracking time course experiments.

Rcell is an R package for data analysis of Cell-ID output.

::DEVELOPER

Laboratorio de Biologia Molecular de Sistemas

:: SCREENSHOTS

:: REQUIREMENTS

  • Windows / Linux

:: DOWNLOAD

Vcellid/CellID/ Rcell

:: MORE INFORMATION

References:

Gordon A, Colman-Lerner A, Chin TE, Benjamin KR, Yu, R.C., Brent R: (2007) Single-cell quantification of molecules and rates using open-source microscope-based cytometry. Nat Methods.

Chernomoretz, A., Bush, A.,Yu, R.,Gordon, A., and Colman-Lerner, A., [2008] Using Cell-ID1.4 with R for microscope-based cytometry. Current Protocols In Molecular Biology.

Exit mobile version