NAViGaTOR 3.0
:: DESCRIPTION
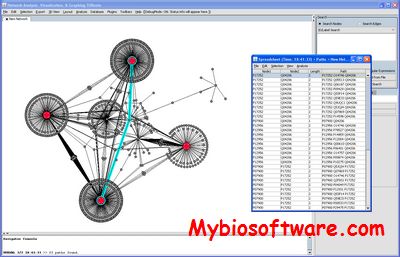
NAViGaTOR (Network Analysis, Visualization, & Graphing TORonto ) is a software package for visualizing and analyzing protein-protein interaction networks.NAViGaTOR can query OPHID / I2D – online databases of interaction data – and display networks in 2D or 3D. To improve scalability and performance, NAViGaTOR combines Java with OpenGL to provide a 2D/3D visualization system on multiple hardware platforms. NAViGaTOR also provides analytical capabilities and supports standard import and export formats such as GO and the Proteomics Standards Initiative (PSI).
::DEVELOPER
Jurisica Lab of the Ontario Cancer Institute
:: SCREENSHOTS
:: REQUIREMENTS
- Windows / Linux / Mac OsX
- Java
:: DOWNLOAD
:: MORE INFORMATION
Citation
Bioinformatics. 2009 Dec 15;25(24):3327-9. doi: 10.1093/bioinformatics/btp595. Epub 2009 Oct 16.
NAViGaTOR: Network Analysis, Visualization and Graphing Toronto.
Brown KR1, Otasek D, Ali M, McGuffin MJ, Xie W, Devani B, Toch IL, Jurisica I.
Djebbari, A., Ali, M., Otasek, D., Kotlyar. M., Fortney, K., Wong, S., Hrvojic, A. and Jurisica, I.
NAViGaTOR: Scalable and Interactive Navigation and Analysis of Large Graphs.
Internet Mathematics, 7(4):314-347, 2011

