ListMath 2.1
:: DESCRIPTION
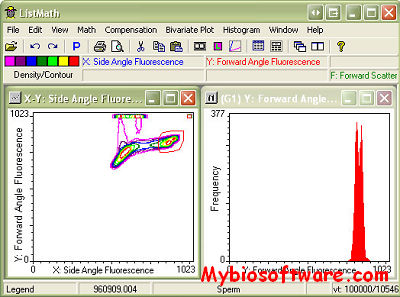
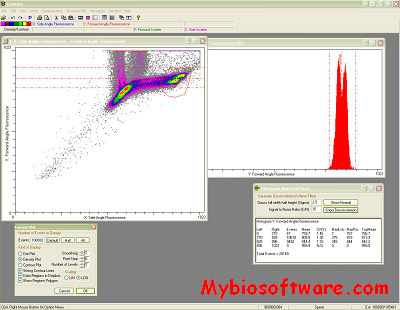
ListMath create histograms, bivariate dot plots, density and contour plots from flow data list files, and it can create regions and gates to do math.
Advertisement
::DEVELOPER
AMC, CMO, Amsterdam, The Netherlands – Contact: R.A.Hoebe -at- amc.nl
:: SCREENSHOTS
:: REQUIREMENTS
- Windows
:: DOWNLOAD
:: MORE INFORMATION
This software is free to anyone, just for fun send author a postcard:
AMC, Cell biology & Histology CMO, Ron Hoebe, Room M3-106-1
Meibergdreef 15, 1105 AZ Amsterdam, The Netherlands


