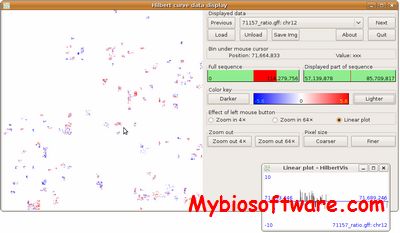
HilbertVis 1.51.0
:: DESCRIPTION
HilbertVis allows to display very long data vectors in a space-efficient manner, allowing the user to visually judge the large scale structure and distribution of features simultaenously with the rough shape and intensity of individual features. A typical use case is ChIP-Chip and ChIP-Seq, or basically all the kinds of genomic data, that are conventionally displayed as quantitative track (“wiggle data”) in genome browsers such as those provided by Ensemble or UCSC.
::DEVELOPER
:: SCREENSHOTS
:: REQUIREMENTS
- Windows / MacOsX / Linux
- R
- BioCOnductor
:: DOWNLOAD
:: MORE INFORMATION
Citation
S. Anders:
“Visualisation of genomic data with the Hilbert curve”
Bioinformatics, Vol. 25 (2009) pp. 1231-1235

