PWKmeans 1.0 – Penalize & weight K-means Extends the Target Function of K-means

PWKmeans 1.0

:: DESCRIPTION

PWKmeans penalized and weighted K-means extends the target function of K-means.

::DEVELOPER

George C. Tseng 

:: SCREENSHOTS

N/A

:: REQUIREMENTS

  • Linux
  • C Compiler

:: DOWNLOAD

 PWKmeans

:: MORE INFORMATION

Citation

George C. Tseng. (2007).
Penalized and weighted K-means for clustering with scattered objects and prior information in high-throughput biological data.
Bioinformatics. 23:2247-2255.
rGN – Ratio-adjusted Gene-wise Normalization

rGN

:: DESCRIPTION

rGN (Ratio-adjusted gene-wise normalization)

::DEVELOPER

George C. Tseng 

:: SCREENSHOTS

N/A

:: REQUIREMENTS

:: DOWNLOAD

 rGN

:: MORE INFORMATION

Citation

Chunrong Cheng, Kui Shen, Chi Song, Jianhua Luo and George C Tseng. (2009)
Ratio Adjustment and Calibration Scheme for Gene-wise Normalization to Enhance Microarray Inter-study Prediction.
Bioinformatics. 25:1655-1661.

MAIA 2.75 – Microarray Image Analysis

MAIA 2.75

:: DESCRIPTION

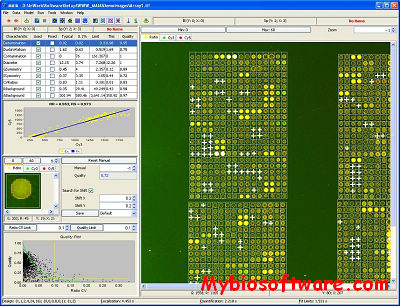
MAIA is a software package for automatic processing of the one- and two- (typically, Cy3-green/Cy5-red) color images produced in cDNA, CGH (comparative genome hybridization) or protein microarray technologies. It incorporates the following modules:

  • The spot localization module
  • The spot quantification module
  • The quality control module
  • The image simulator

::DEVELOPER

Institut Curie

:: SCREENSHOTS

:: REQUIREMENTS

:: DOWNLOAD

MAIA

:: MORE INFORMATION

ViDaExpert 1.2 – Multidimensional Vectorial data Visualization

ViDaExpert 1.2

:: DESCRIPTION

ViDaExpert (VIsualization of DAta) is a software for multidimensional vectorial data visualization (ViDa stands for VIsualization of DAta). ViDaExpert was shown to be a useful tool, in particular, in analysis of microarray data. There are special panels integrated to support analysis of microarray data (for example, dot-plots). In Sitcon project it is used to perform PCA analysis of microarray data, including time series.

::DEVELOPER

Andrei Zinovyev

:: SCREENSHOTS

:: REQUIREMENTS

  • Windows

:: DOWNLOAD

 ViDaExpert

:: MORE INFORMATION

References

  1. Gorban A., Zinovyev A. Elastic Principal Graphs and Manifolds and their Practical Applications. Computing, 2005 (PDF)
  2. Andrei Zinovyev. Method And Software For Fast Construction Of Principal Manifolds Approximations. (PDF)
  3. Alexander Gorban, Andrei Zinovyev. Visualization of Data by Method of Elastic Maps and Its Applications in Genomics, Economics and Sociology. (PDF)
  4. Alexander Gorban, Andrei Zinovyev and Donald Wunsch. Application of the method of elastic maps in analysis of genetic texts. (PDF)

RMAExpress 1.2.0 – Generate RMA Expression Measures for Affy data

RMAExpress 1.2.0

:: DESCRIPTION

RMAExpress is a standalone GUI program for Windows (and Linux) to compute gene expression summary values for Affymetrix Genechip® data using the Robust Multichip Average expression summary and to carry out quality assessment using probe-level metrics.

::DEVELOPER

Ben Bolstad

:: SCREENSHOTS

:: REQUIREMENTS

  • Linux/ MacOsX / Windows

:: DOWNLOAD

 RMAExpress

:: MORE INFORMATION

ScoreGene 1.0 – A Gene Expression Data Analysis toolkit

ScoreGene 1.0

:: DESCRIPTION

ScoreGenes is a data analysis toolkit designed for large sets of gene expressions over various experiments. ScoreGenes includes methods for evaluating data sets, discovering informative genes that are differentially expressed across the classes, classifying the experiments using supervised learning algorithms, and clustering the genes using semi-supervised learning method. This toolkit efficiently handles large data sets.

::DEVELOPER

Nir Friedman’s Lab

:: SCREENSHOTS

N/A

:: REQUIREMENTS

  • Windows/Linux

:: DOWNLOAD

 ScoreGene

:: MORE INFORMATION

Gemma 1.27.4 – Analyze Genomics data using Meta-analysis

Gemma 1.27.4

:: DESCRIPTION

Gemma is an open-source database and software system for the meta-analysis of gene expression data.

::DEVELOPER

Pavlidis lab

:: SCREENSHOTS

N/A

:: REQUIREMENTS

  • Linux / MacOsX
  • Web Server

:: DOWNLOAD

 Gemma

:: MORE INFORMATION

Citation

Bioinformatics. 2009 Jun 15;25(12):1543-9. Epub 2009 Apr 17.
Application and evaluation of automated semantic annotation of gene expression experiments.
French L, Lane S, Law T, Xu L, Pavlidis P.

matrix2png 1.2.2 – Visualization tool for Display of Matrix data

matrix2png 1.2.2

:: DESCRIPTION

matrix2png is a visualization tool for the display of matrix data.Matrix2png is a simple but powerful program for making visualizations of microarray data and many other data types. It generates PNG formatted images from text files of data. It is fast, easy to use, and reasonably flexible. It can be used to generate publication-quality images, or to act as a image generator for web applications. Our group has found it useful for imaging all kinds of matrix-based data, not just microarray data.

::DEVELOPER

Pavlidis lab

:: SCREENSHOTS

N/A

:: REQUIREMENTS

  • Linux / MacOsX / Windows with Cygwin

:: DOWNLOAD

 matrix2png

:: MORE INFORMATION

Citation

Pavlidis, P. and Noble W.S. (2003)
Matrix2png: A Utility for Visualizing Matrix Data.
Bioinformatics 19: 295-296

ErmineJ 3.2 – Analysis of Gene sets in Expression Microarray data

ErmineJ 3.2

:: DESCRIPTION

ErmineJ performs analyses of gene sets in expression microarray data. A typical goal is to determine whether particular biological pathways are “doing something interesting” in the data. The software is designed to be used by biologists with little or no informatics background.

::DEVELOPER

Pavlidis lab

:: SCREENSHOTS

:: REQUIREMENTS

  • Windows / Linux / Mac OsX
  • java

:: DOWNLOAD

 ErmineJ

:: MORE INFORMATION

Citation

Lee H.K., Braynen W., Keshav K. and Pavlidis P. (2005)
ErmineJ: Tool for functional analysis of gene expression data sets.
BMC Bioinformatics 6:269.

VennMaster 0.38.2 – Venn Diagram Drawing tool for MicroArray Analysis

VennMaster 0.38.2

:: DESCRIPTION

VennMaster is a tool for drawing area proportional Venn/Euler-diagrams by importing gene lists from GoMiner.

::DEVELOPER

Medical Systems Biology, University of Ulm

:: SCREENSHOTS

:: REQUIREMENTS

  • Linux / Windows /MacOsX
  • Java

:: DOWNLOAD

 VennMaster

:: MORE INFORMATION

Citation

Hans A Kestler et al.
VennMaster: Area-proportional Euler diagrams for functional GO analysis of microarrays
BMC Bioinformatics 2008, 9:67

Exit mobile version