CNIT 5.1 – Copy Number Inferring tool

CNIT 5.1

:: DESCRIPTION

CNIT is designed for Affymetrix GeneChip to analyze copy number of each SNP allele. CNIT can be applicable in chromosome-abnormal disease, cancer and copy number variation studies, and can provide accurate CN estimations with low false-positive rate.

::DEVELOPER

Cathy S.J. Fann lab,Institute of Biomedical Informatics, National Yang-Ming University, Taipei

:: SCREENSHOTS

N/A

:: REQUIREMENTS

  • Linux / Windows
  • R package

:: DOWNLOAD

 CNIT

:: MORE INFORMATION

Citation

Genome-wide copy number analysis using copy number inferring tool (CNIT) and DNA pooling.
Lin CH, Huang MC, Li LH, Wu JY, Chen YT, Fann CS.
Hum Mutat. 2008 Aug;29(8):1055-62

OpWise – Operons Aid the Identification of differentially Expressed Genes in Bacterial Microarray Experiments

OpWise

:: DESCRIPTION

To estimate the reliability of bacterial microarray experiments, OpWise uses the agreement of measurements within operons to estimate the amount of systematic bias in the data. OpWise relies on the MicrobesOnline operons predictions.

::DEVELOPER

Morgan N. PriceAdam P. Arkin, and Eric J. Alm

:: SCREENSHOTS

N/A

:: REQUIREMENTS

  • Windows / Linux / Mac OsX
  • R package

:: DOWNLOAD

 OpWise

:: MORE INFORMATION

Citation

BMC Bioinformatics. 2006 Jan 13;7:19.
OpWise: operons aid the identification of differentially expressed genes in bacterial microarray experiments.
Price MN, Arkin AP, Alm EJ.

ExonMiner – Web Service for GeneChip Exon Array Data Analysis

ExonMiner

:: DESCRIPTION

ExonMiner is the first all-in-one web service for analysis of exon array data to detect transcripts that have significantly different splicing patterns in two cells, e.g. normal and cancer cells.

::DEVELOPER

ExonMiner team

:: SCREENSHOTS

N/A

:: REQUIREMENTS

  • Web Browser

:: DOWNLOAD

 NO

:: MORE INFORMATION

Citation

BMC Bioinformatics. 2008 Nov 26;9:494. doi: 10.1186/1471-2105-9-494.
ExonMiner: Web service for analysis of GeneChip Exon array data.
Numata K, Yoshida R, Nagasaki M, Saito A, Imoto S, Miyano S.

ArrayCluster 1.0 – Mixed Factors Analysis of Microarray Gene Expression Data

ArrayCluster 1.0

:: DESCRIPTION

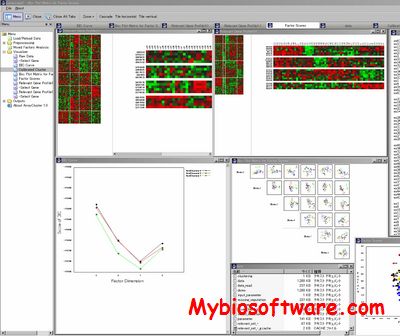
ArrayCluster is one of the significant challenges in gene expression analysis to find unknown subtypes of several diseases at the molecular levels. This task can be addressed by grouping gene expression patterns of the collected samples on the basis of a large number of genes. Application of commonly used clustering methods to such a dataset however are likely to fail due to over-learning, because the number of samples to be grouped is much smaller than the data dimension which is equal to the number of genes involved in the dataset. To overcome such difficulty, we developed a novel model-based clustering method, referred to as the mixed factors analysis.

::DEVELOPER

ArrayCluster Team

:: SCREENSHOTS

:: REQUIREMENTS

  • Windows

:: DOWNLOAD

 ArrayCluster

:: MORE INFORMATION

Citation

Bioinformatics. 2006 Jun 15;22(12):1538-9.
ArrayCluster: an analytic tool for clustering, data visualization and module finder on gene expression profiles.
Yoshida R, Higuchi T, Imoto S, Miyano S.

GenoMap 1.0 – Graphical Representation of Microarray data

GenoMap 1.0

:: DESCRIPTION

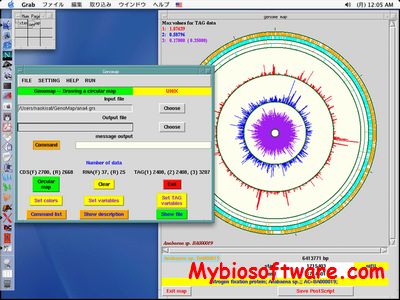
GenoMap is a viewer for genome-wide map of microarray expression data within a circular bacterial genome

::DEVELOPER

Sato Lab

:: SCREENSHOTS

GenoMap

:: REQUIREMENTS

  • Linux / Windows/MacOsX
  • TCL/Tk

:: DOWNLOAD

 GenoMap

:: MORE INFORMATION

Citation

Bioinformatics. 2003 Aug 12;19(12):1583-4.
GenoMap, a circular genome data viewer.
Sato N, Ehira S.

EGPC / MVGPC 1.0 – Multi-class Classifier for Microarray data

EGPC / MVGPC 1.0

:: DESCRIPTION

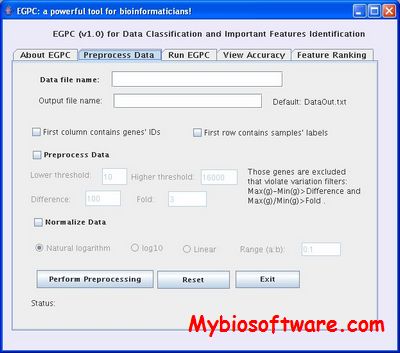
EGPC / MVGPC (majority voting genetic programming classifier)is a multi-class classifier based on genetic programming and majority voting for microarray data.

::DEVELOPER

IBA Laboratory, The University of Tokyo

:: SCREENSHOTS

EGPC

:: REQUIREMENTS

  • Linux /windows/MacOsX
  • Java

:: DOWNLOAD

 EGPC / MVGPC 

:: MORE INFORMATION

Citation

IEEE/ACM Trans Comput Biol Bioinform. 2009 Apr-Jun;6(2):353-67. doi: 10.1109/TCBB.2007.70245.
Prediction of cancer class with majority voting genetic programming classifier using gene expression data.
Paul TK, Iba H.

Mixer 1.03 – ChIP-chip Analysis by Mixture Model approach

Mixer 1.03

:: DESCRIPTION

Mixer is a mixture model approach to analyze ChIP-chip or ChIP-seq data, also with some utility functions to process DNA sequence data. It includes statistical methods for both data normalization and peak detection. The peak detection and quantification relies on a mixer model approach that dissects the distribution of background signals and the Immunoprecipitated signals. In contrast to many existing methods, mixer is more flexible by imposing less restrictive assumptions and allowing a relatively large proportion of peak regions. Robust performance on data sets predicted to contain numerous peaks is very important for the studies of the transcription factors with abundant binding sites, and common chromatin features or epigenetic marks.

::DEVELOPER

Wei Sun

:: SCREENSHOTS

N/A

::REQUIREMENTS

:: DOWNLOAD

  Mixer

:: MORE INFORMATION

Citation

Wei Sun, Michael J Buck, Mukund Patel and Ian J Davis (2009),
Improved ChIP-chip analysis by mixture model approach.
BMC Bioinformatics 2009, 10:173

MetaDE 1.0.5 – Meta-analysis for Differential Expression Analysis

MetaDE 1.0.5

:: DESCRIPTION

MetaDE (Meta-analysis for Differential Expression Analysis)

::DEVELOPER

George C. Tseng 

:: SCREENSHOTS

N/A

:: REQUIREMENTS

:: DOWNLOAD

 MetaDE

:: MORE INFORMATION

Citation

Jia Li and George C. Tseng. (2010)
An adaptively weighted statistic for detecting differential gene expression when combining multiple transcriptomic studies.
Annals of Applied Statistics 2011, Vol. 5, No. 2A, 994-1019

Shuya Lu, Jia Li, Chi Song, Kui Shen and George C Tseng. (2010)
Biomarker Detection in the Integration of Multiple Multi-class Genomic Studies.
Bioinformatics. 26:333-340.

R functions for cDNA array analysis – cDNA Microarray Analysis

R functions for cDNA array analysis

:: DESCRIPTION

R functions for cDNA array analysis is a set of R functions for filtering, normalization, Bayesian hierarchical modelling and MCMC procedures in cDNA microarray analysis.

::DEVELOPER

George C. Tseng 

:: SCREENSHOTS

N/A

:: REQUIREMENTS

:: DOWNLOAD

  R functions for cDNA array analysis

:: MORE INFORMATION

Citation

George C. Tseng, Min-Kyu Oh, Lars Rohlin, James C. Liao, Wing Hung Wong (2001)
Issues in cDNA microarray analysis: quality filtering, channel normalization, models of variations and assessment of gene effects,
Nucleic Acids Res v29 p2549

TightClust 1.0 – Resampling Based Clustering Method for Microarray data

TightClust 1.0

:: DESCRIPTION

TightClust applies K-means clustering as an intermediate clustering engine. Early truncation of a hierarchical clustering tree is used to overcome the local minimum problem in K-means clustering. The tightest and most stable clusters are identified in a sequential manner through an analysis of the tendency of genes to be grouped together under repeated resampling.

::DEVELOPER

George C. Tseng 

:: SCREENSHOTS

N/A

:: REQUIREMENTS

:: DOWNLOAD

 TightClust

:: MORE INFORMATION

Citation

George C. Tseng and Wing H. Wong. (2005)
Tight Clustering: A Resampling-based Approach for Identifying Stable and Tight Patterns in Data.
Biometrics.61:10-16.